One-Way ANOVA Tutorial in Bangla | Easy Statistics for Data Enthusiasts
Автор: Learn with Sojol
Загружено: 2023-12-06
Просмотров: 2162
Описание:
In this video, you will learn One-Way ANOVA in Bangla, a powerful statistical method to compare the means of two or more independent groups. 📊✨ This tutorial explains the null and alternative hypotheses, the calculation of the F-statistic, and how to interpret the results. By the end of this video, you will understand when and how to apply One-Way ANOVA in real-world data analysis. 🌟
What you'll learn:
✅ What is One-Way ANOVA?
✅ When to use it for statistical analysis.
✅ Step-by-step calculation of the F-statistic.
✅ How to interpret One-Way ANOVA results.
Solved Question:
📂https://drive.google.com/file/d/1rpVe...
Practice with solution:
📝https://drive.google.com/file/d/10MNI...
🔗Find me o https://sorifulinsights.odoo.com/
🔗Facebook / sorifulislamsojol111
🔗Linkedin / sorifulislamdataanalyst
Related Videos
📹Two way Anova • Two-Way ANOVA Bangla Tutorial | Data Analy...
📹 Hypothesis Testing • Z-Test দিয়ে Hypothesis Testing এর 6টি ধাপ...
📹 T Test • T test in Bangla explained #ttest#Statis...
📹 Regression Analysis • Pearson Correlation Coefficient (in Bangla...
Details
In this video, we will learn about the one-way ANOVA 🧠, a powerful statistical test used to compare the means of two or more independent groups. 📈 We will discuss the null and alternative hypotheses, the calculation of the F-statistic, and how to interpret the results. By the end of this video, you will be able to apply the one-way ANOVA to your own data! 💪
What is a one-way ANOVA?
A one-way ANOVA is a statistical test used to compare the means of two or more independent groups. It is called "one-way" because there is only one factor being compared. The ANOVA stands for "analysis of variance." 📊
When to use a one-way ANOVA:
The one-way ANOVA is appropriate when you have:
✔️ Two or more independent groups
✔️ A normally distributed dependent variable
✔️ Equal variances across groups
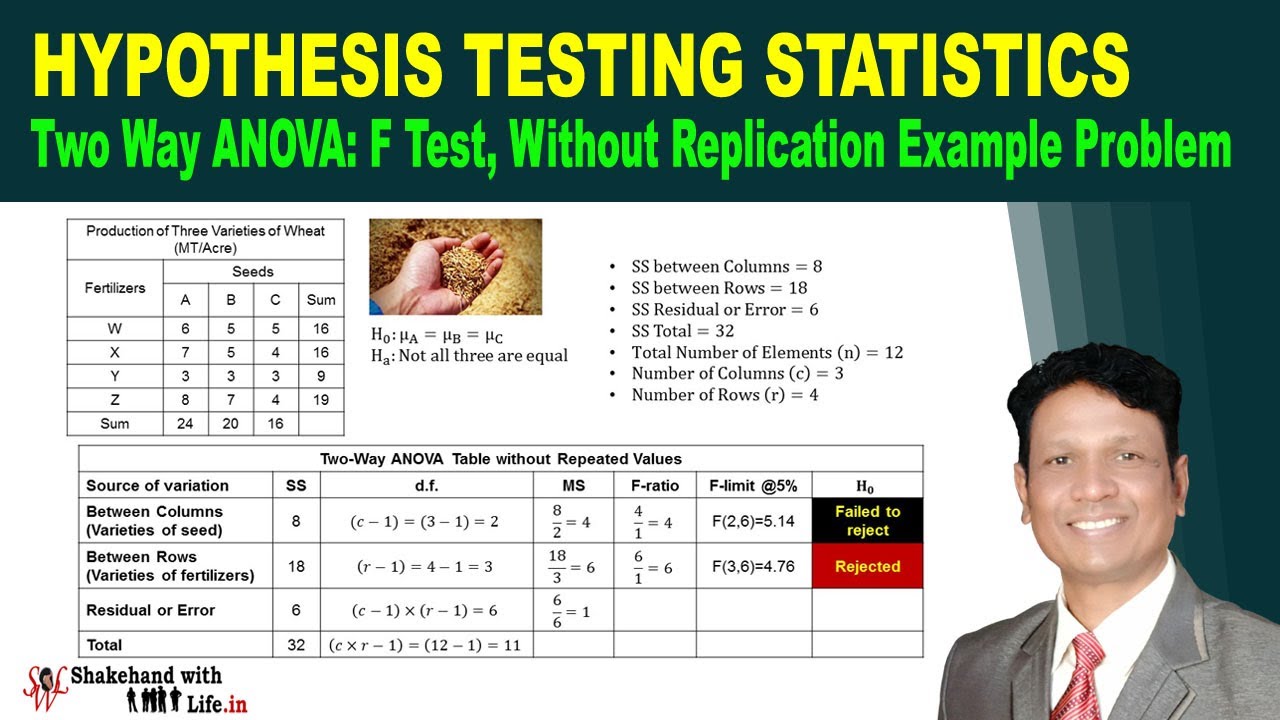
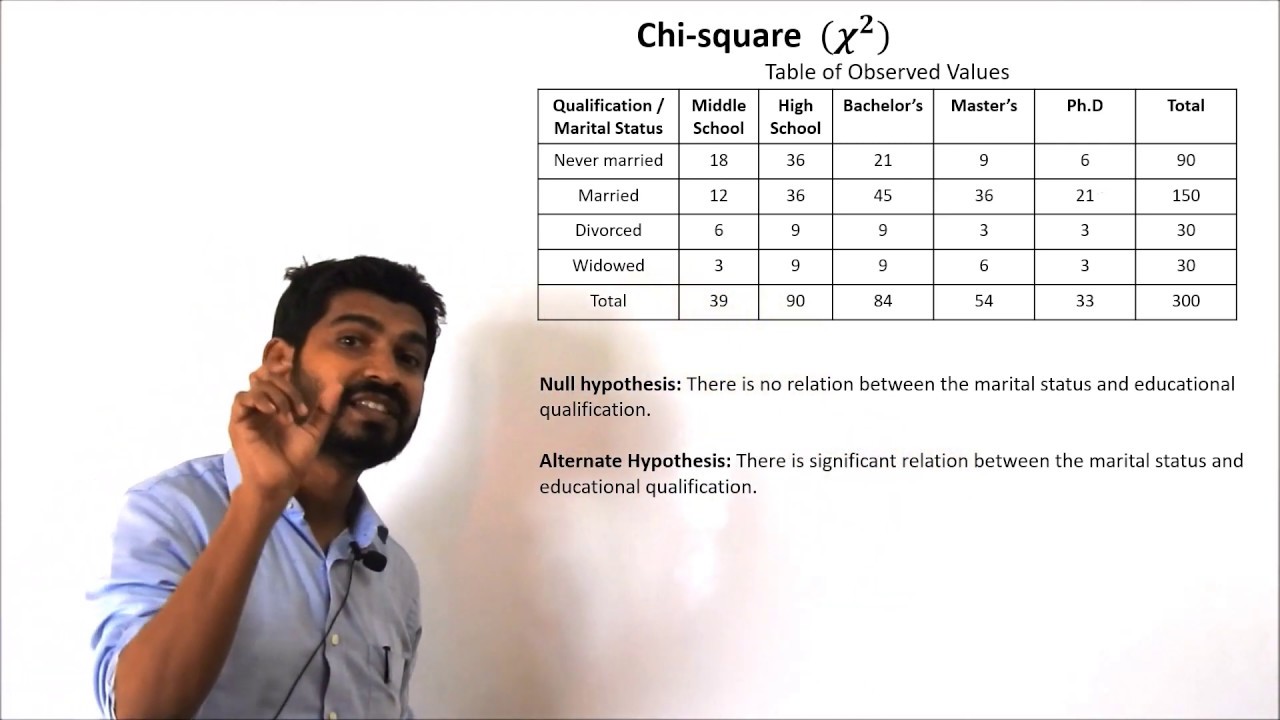
The null and alternative hypotheses:
The null hypothesis (H0): There is no difference in the means of the groups.
The alternative hypothesis (Ha): There is at least one difference in the means of the groups.
Calculation of the F-statistic:
The F-statistic is a measure of the difference between the variability within groups and the variability between groups. 🧮 It is calculated as follows:
📏 F = MST / MSE
where:
📌 MST is the mean square between groups
📌 MSE is the mean square within groups
Interpretation of the results:
The F-statistic is used to test the null hypothesis. If the F-statistic is greater than the critical value, we reject the null hypothesis ❌ and conclude that there is a statistically significant difference in the means of the groups. ✅
#OneWayANOVA
#BanglaStatistics
#DataAnalysisInBangla
#StatisticalAnalysis
#LearnStatistics
#FStatisticExplained
#HypothesisTesting
#BanglaTutorial
#ANOVAForBeginners
#StatisticsMadeEasy
#AnalysisOfVariance
#DataScienceBangla
#MathInBangla
#StatisticalTests
#BanglaLearning
#StepByStepANOVA
#DataScienceForBeginners
#StatisticsTutorial
#RealWorldDataAnalysis
#StatisticalMethods
Повторяем попытку...

Доступные форматы для скачивания:
Скачать видео
-
Информация по загрузке: