PUM2023W 02 Regression
Автор: Michele Piecucci
Загружено: 2026-03-04
Просмотров: 11
Описание:
• PUM2023W 02 Regression
Regression, Data Types, and the Machine Learning Pipeline
Defining Intelligence in the Context of AI
In artificial intelligence, intelligence is the ability to efficiently behave in a new situation.
Efficiently: A system needs a goal function (e.g., fastest vs. shortest route) to define "best."
Behave: The system must execute decisions. An agent (software) makes the call, and the body (hardware) performs it.
New Situation: The system must generalize knowledge to novel environments. This is called transfer.
The Core Machine Learning Problems
Regression: Predicting a numerical variable.
Classification: Predicting a categorical variable.
Segmentation (Clustering): Finding hidden patterns without a target variable.
Regression and classification are both prediction problems.
Understanding Regression
If you plot flat sizes against sales prices, a linear pattern often emerges. A trend line expressed as an equation (e.g., y = 79.9 * x) allows a model to estimate the price of a flat size it has never seen before, demonstrating intelligence through generalization.
Multiple Regression and Feature Engineering
Real-world problems involve many variables (features). In the Ames Housing dataset, using 79 features instead of one can drop the Mean Absolute Percentage Error (MAPE) from 26% to 11%. Machine learning excels at detecting these multi-dimensional patterns.
Common Regression Metrics:
R2 Score: Measures explained variance.
RMSE (Root Mean Square Error): Measures standard deviation of errors.
MAPE: Expresses error as a percentage for business clarity.
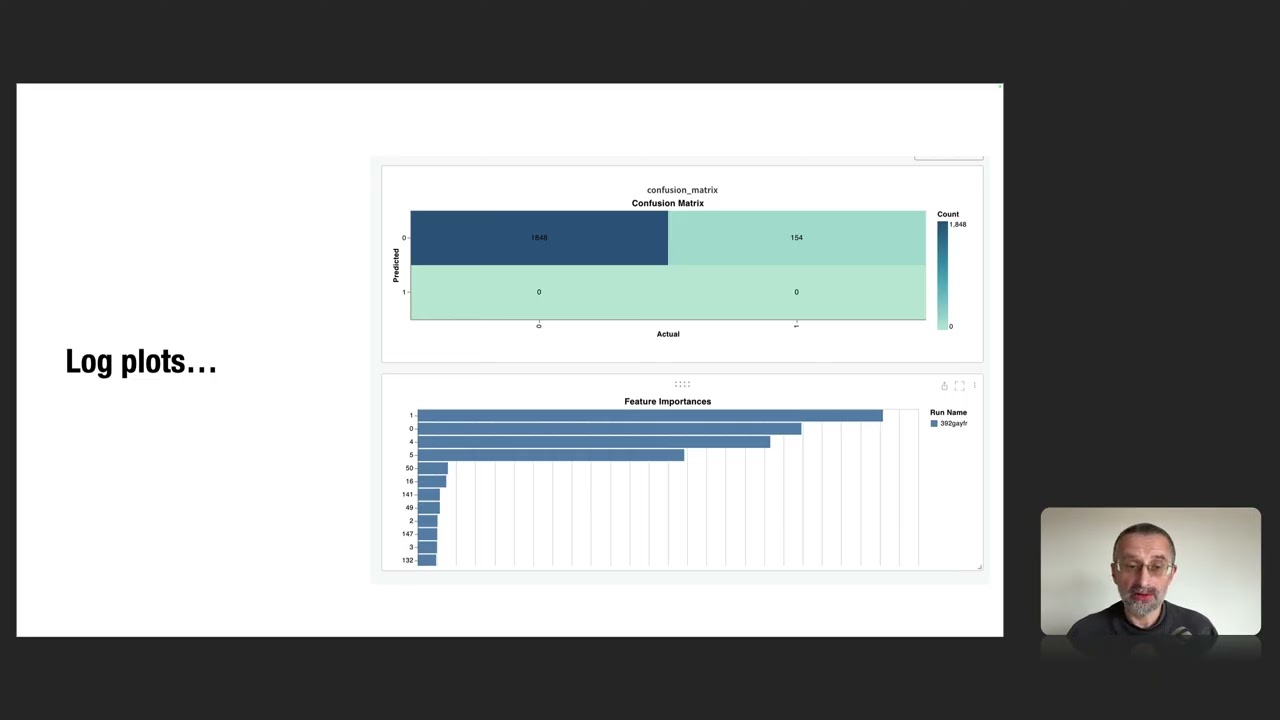
Feature Importance and Business Value
Feature Importance identifies which variables impact predictions most. In housing, these are often Overall Quality and Living Area.
Business Applications:
Automated Valuation: Objective property pricing.
Arbitrage: Finding undervalued assets.
Strategic Renovation: Identifying which upgrades add the most value.
Predicting Customer Lifetime Value (CLV)
Regression can predict total future revenue from a customer based on their first purchase, location, and behavior.
Correlation vs. Causation
Models find correlations (variables moving together), not necessarily causes.
Ice Cream and Murders: Both increase due to heat (the confounder).
Fire Trucks and Damage: Large fires cause both.
To find true causation, businesses use A/B testing or Causal Machine Learning.
The Machine Learning Pipeline
A pipeline is a sequence of actions on artifacts (data/models).
Training Stage: Historical data is used to create a trained model.
Inference Stage: The model predicts values for new data.
Strategy Tip: Focus marketing on "remaining potential" (Predicted CLV minus Spend to Date) rather than just the highest predicted spenders.
Data Types and Visualization
Numerical Variables: Quantitative measurements (price, weight). You can calculate metrics like mean or standard deviation.
Categorical Variables: Qualitative descriptions (region, gender). You can only count frequencies.
Nominal: No order (Dog, Cat).
Ordinal: Logical sequence (Small, Medium, Large).
Interval: Binned ranges (Age 18-24).
Note: IDs and Zip Codes are categorical, even if they are numbers.
Visualization Guide:
Numerical across Categorical: Bar Chart.
Distribution of one Numerical: Histogram.
Correlation of two Numericals: Scatter Plot.
Numerical over Time: Line Chart.
Target Variable Type:
Numerical Target = Regression.
Categorical Target = Classification.
Повторяем попытку...

Доступные форматы для скачивания:
Скачать видео
-
Информация по загрузке: