ycliper

Популярное

Музыка Кино и Анимация Автомобили Животные Спорт Путешествия Игры Юмор

Интересные видео

2025 Сериалы Трейлеры Новости Как сделать Видеоуроки Diy своими руками

Топ запросов

смотреть а4 schoolboy runaway турецкий сериал смотреть мультфильмы эдисон
Скачать

Excel Charts for Beginners - Create Team Skill Charts In Excel to Enable Skill Gap Analysis

Автор: Stuart Taylor - Project Management

Загружено: 2021-03-22

Просмотров: 12787

Описание: 
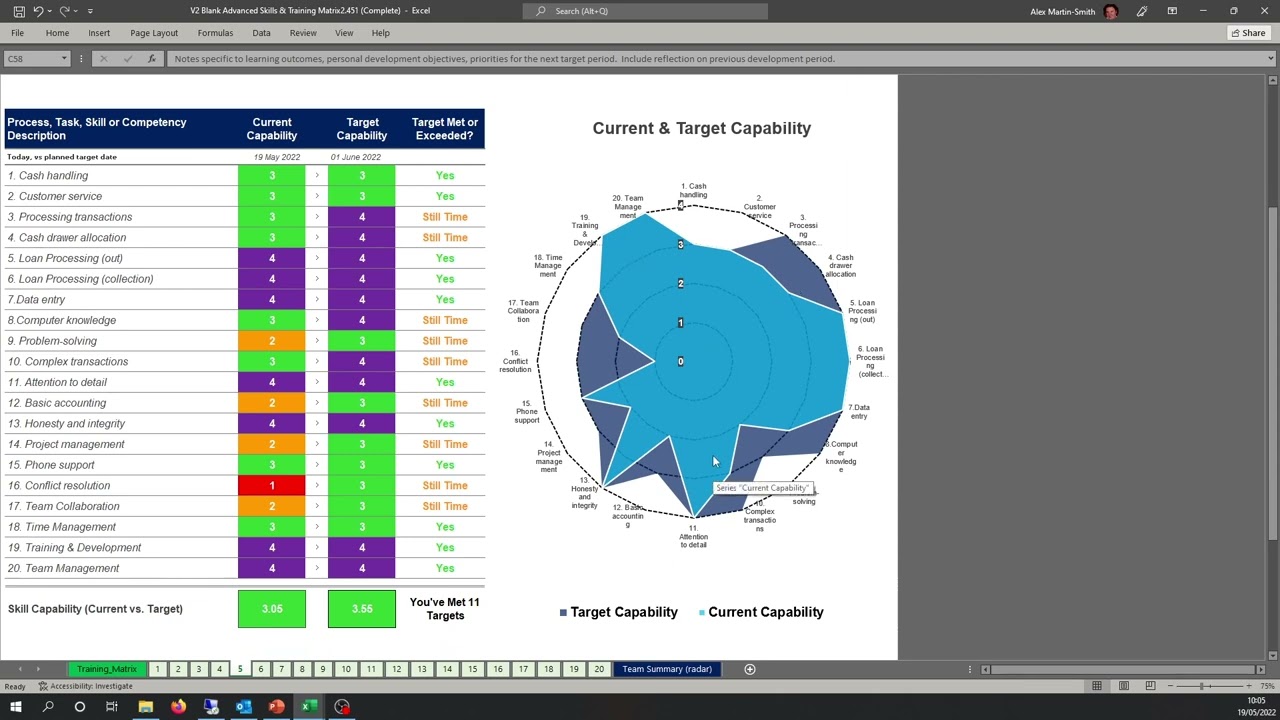
A video showing how to create useful charts to see team skills (and skill gaps) in Excel. This builds on the Excel tutorial for creating a skills matrix in the previous video, which can be found here:    • Making a Skills Matrix for your Team with ...  

This demonstrates the use of the vlookup function, the iferror function and the creation of Excel charts. All of this will be useful to managers that are interested in assessing the skills levels and skills gaps within their teams - either for the entire team or cohorts.

💡 Need expert guidance?
🔹 Looking for your first or next project management job? → Check out my course: https://geni.us/FindYourNextPMJob
🔹 For project professionals → If you're looking for career advice, mentorship, or support in managing your projects, book a 1:1 coaching session with me: https://calendly.com/influentialpmo/a...
🔹 For organisations → If your company needs PMO or project assurance services, book a call to discuss how I can help: https://calendly.com/influentialpmo/i...
#projectmanagement #pmo


Timestamps:
0:00 - Intro
1:30 - Add team or cohort category by adding a column in Excel
3:01 - Create the Team worksheet in Excel
5:09 - Using the IfError function and Vlookup function in Excel
12:00 - Using the Average function in Excel
13:14 - Creating charts in Excel that are updated by our Vlookup data and team average scores - creating a radar chart in Excel
15:35 - Formatting charts in Excel
18:50 - Creating charts in Excel that are updated by our Vlookup data and team average scores - creating a column chart in Excel
24:11 - The benefit of simplicity
26:35 - Fixing common errors and problems

To download my copy of this template, sign up for the Influential PMO newsletter at: https://geni.us/skillsmatrix

#excel #team

Не удается загрузить Youtube-плеер. Проверьте блокировку Youtube в вашей сети.
Повторяем попытку...
Excel Charts for Beginners - Create Team Skill Charts In Excel to Enable Skill Gap Analysis

Поделиться в:

Доступные форматы для скачивания:

Скачать видео

  • Информация по загрузке:

Скачать аудио

Похожие видео

Make a RACI with Excel - Simple Tutorial

Make a RACI with Excel - Simple Tutorial

Создание матрицы навыков для вашей команды с помощью Excel

Создание матрицы навыков для вашей команды с помощью Excel

What Goes Into a Project Status Report Template?

What Goes Into a Project Status Report Template?

📊 How to Build Excel Interactive Dashboards

📊 How to Build Excel Interactive Dashboards

Tableau Crash Course Tutorial - Analysing and Visualising Data with Maps, Tables and Parameters

Tableau Crash Course Tutorial - Analysing and Visualising Data with Maps, Tables and Parameters

Фишки Excel, которые я использую КАЖДЫЙ ДЕНЬ! ЭТО нужно каждому

Фишки Excel, которые я использую КАЖДЫЙ ДЕНЬ! ЭТО нужно каждому

How to Create a Training Matrix in Excel

How to Create a Training Matrix in Excel

Почему не 6 и не 8 — история пятипалой руки!

Почему не 6 и не 8 — история пятипалой руки!

Advanced Skills and Training Matrix v2. The essential management tool for improving team capability.

Advanced Skills and Training Matrix v2. The essential management tool for improving team capability.

How To Create A RACI Matrix In Excel - Step By Step - Or Get My Free Template!

How To Create A RACI Matrix In Excel - Step By Step - Or Get My Free Template!

👳‍♂️ ЗЕЛЁНЫЙ АЯТОЛЛА и ТРАМП В ПОСУДНОЙ ЛАВКЕ. Макрон в Ормузском проливе. Погоня за ТЦК - Арестович

👳‍♂️ ЗЕЛЁНЫЙ АЯТОЛЛА и ТРАМП В ПОСУДНОЙ ЛАВКЕ. Макрон в Ормузском проливе. Погоня за ТЦК - Арестович

AWESOME Excel Charts & Visuals | For Business & Finance Professionals

AWESOME Excel Charts & Visuals | For Business & Finance Professionals

Музыка для работы за компьютером | Фоновая музыка для концентрации и продуктивности

Музыка для работы за компьютером | Фоновая музыка для концентрации и продуктивности

SolidWorks. Вырез твердым телом по траектории. Панель Элементы

SolidWorks. Вырез твердым телом по траектории. Панель Элементы

How to Create a Merit Matrix for Salary Increase with Goal Seek Function

How to Create a Merit Matrix for Salary Increase with Goal Seek Function

How to create a skills matrix : The easy Way - with an Excel Spreadsheet

How to create a skills matrix : The easy Way - with an Excel Spreadsheet

GEMINI: ПОЛНЫЙ УРОК для новичков. Бесплатно. NotebookLM

GEMINI: ПОЛНЫЙ УРОК для новичков. Бесплатно. NotebookLM

Pivot Table with Progress Chart and Dashboard

Pivot Table with Progress Chart and Dashboard

How to Create a Dashboard in Excel - The Most Detailed Guide

How to Create a Dashboard in Excel - The Most Detailed Guide

Make an AWESOME Dynamic Chart with Checkboxes in Excel ✔ (No VBA)

Make an AWESOME Dynamic Chart with Checkboxes in Excel ✔ (No VBA)

© 2025 ycliper. Все права защищены.


  • Контакты
  • О нас
  • Политика конфиденциальности


Контакты для правообладателей: [email protected]