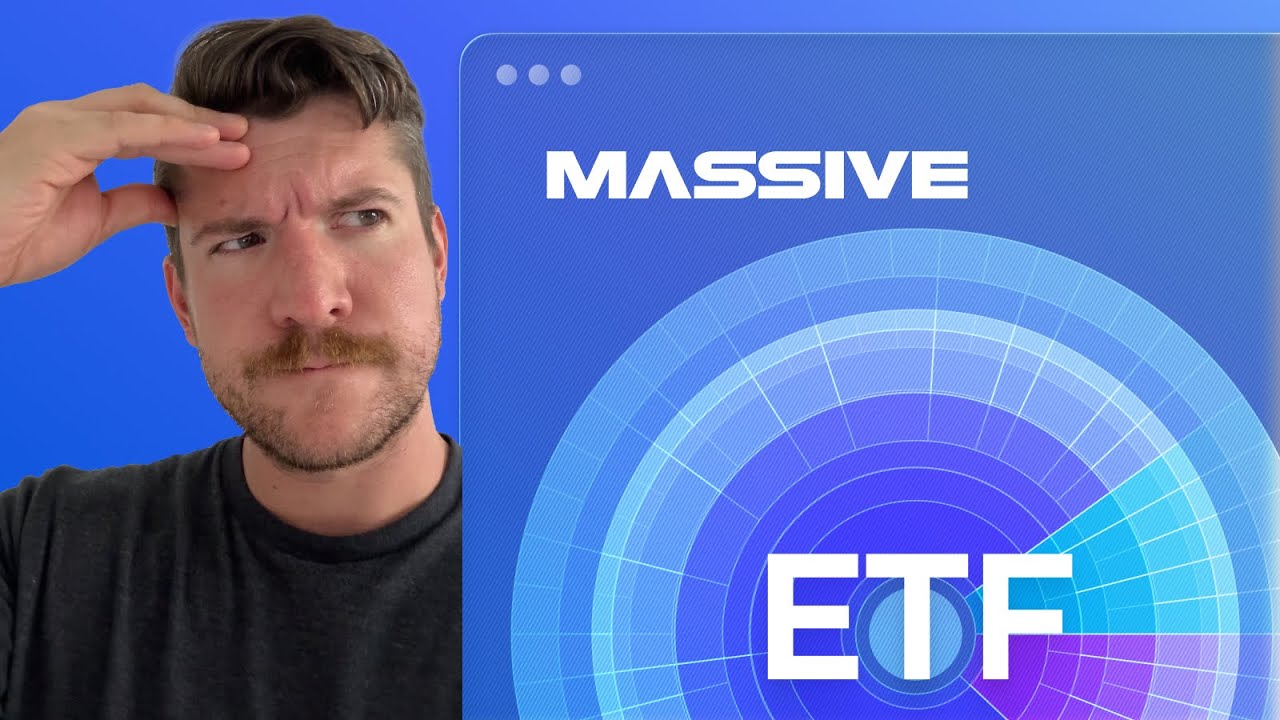
Building an ETF Research Dashboard with Massive + ETF Global®
Автор: Massive
Загружено: 2026-01-07
Просмотров: 85
Описание:
See how to use Massive’s ETF Global® endpoints to analyze ETF holdings, track fund flows, and evaluate risk and reward metrics in seconds. This walkthrough shows how an interactive Streamlit dashboard pulls institutional-grade ETF data, combines five distinct endpoints, and turns raw API responses into actionable insights you can use for research, screening, and strategy development.
You’ll see how the app retrieves constituent-level holdings to calculate concentration metrics, builds rolling z-scores to detect fund flow momentum, renders proprietary risk and reward scorecards, and synthesizes everything into a clear narrative view of ETF health. If you’re exploring how Massive’s ETF Global® add-ons can support ETF research workflows, this demo provides a practical look at what’s possible when you combine normalized data with lightweight analytics.
The code for this demo is located in our community repository:
https://github.com/massive-com/commun...
Key takeaways:
→ How to access institutional-grade ETF data through Massive
→ How to pull constituents, fund flows, analytics, profiles, and taxonomies
→ How concentration (HHI) and fund flow z-scores are calculated
→ How proprietary risk and reward scores are visualized
→ How to combine multiple endpoints into a single research dashboard
Chapters:
00:00 – What ETF Global® is and what data it provides
00:19 – Overview of the five ETF Global® endpoints
00:39 – Cloning the repo and setting up your API key
00:58 – Dashboard walkthrough
You can find the blog post that goes along with this video here, which details the partnership, endpoints, and full demo walkthrough: https://massive.com/blog/announcing-m...
Not financial advice.
Повторяем попытку...
Доступные форматы для скачивания:
Скачать видео
-
Информация по загрузке:


![Pine Script: ULTIMATE BEGINNER'S GUIDE! 💹 [2024]](https://image.4k-video.ru/id-video/HYyuYgPRLpc)