Power BI Data Analyst Project | Sales Dashboard with DAX & YoY Analysis
Автор: Data Insights
Загружено: 2026-02-13
Просмотров: 64
Описание:
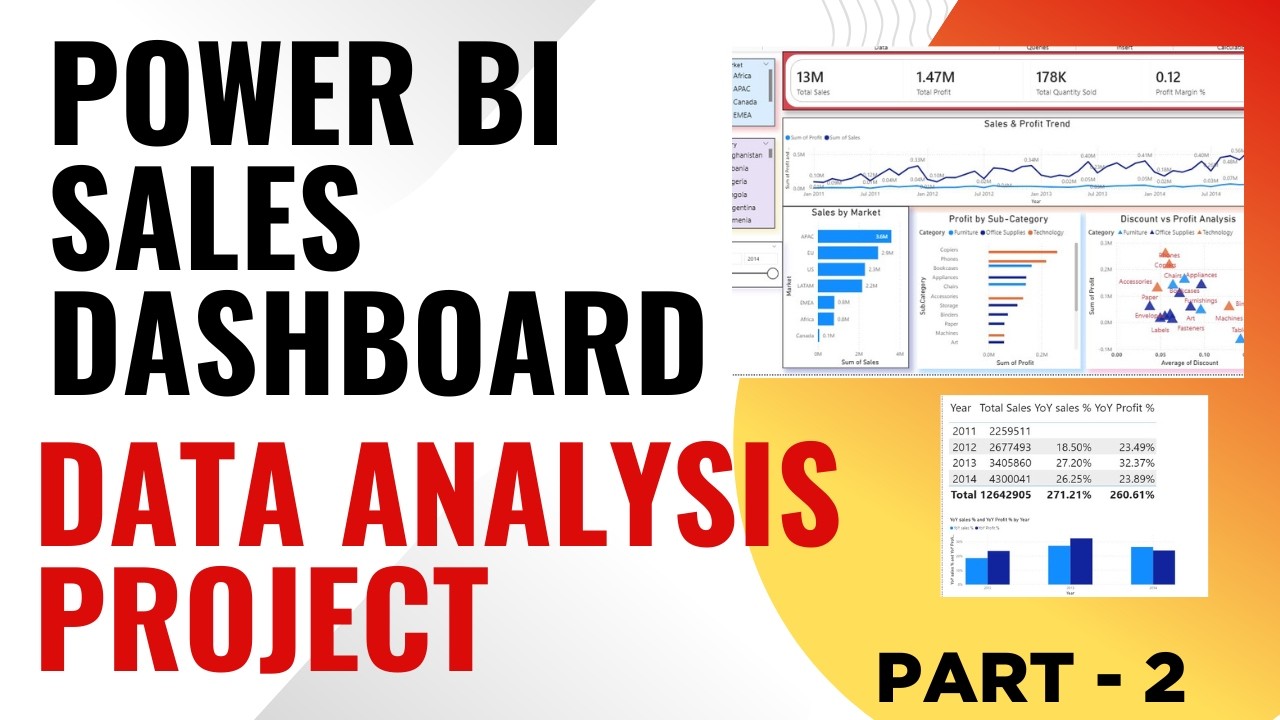
In this video, I build a complete Sales Performance Dashboard in Power BI.
This project includes:
Data modeling with Date table
DAX measures (Total Sales, Total Profit, Profit Margin)
Year-over-Year (YoY) Growth calculation
Sales by Market & Region analysis
Category and Sub-category profitability
Discount impact analysis (Scatter plot)
Key Concepts Covered:
• DAX Basics
• SAMEPERIODLASTYEAR
• KPI Measures
• Profit Margin Calculation
• Business Insight Development
This is a complete end-to-end Power BI portfolio project for aspiring data analysts.
Part 1 (Excel Data Cleaning):
[Add Excel video link here]
GitHub Repository:
[Add GitHub link]
#PowerBI #DataAnalytics #DAX #BusinessIntelligence #DataAnalystProject
Повторяем попытку...
Доступные форматы для скачивания:
Скачать видео
-
Информация по загрузке: