Omics Playground | Expression Analysis (video tutorial 5)
Автор: BigOmics Analytics
Загружено: 2019-10-15
Просмотров: 329
Описание:
The Differential Expression Analysis module compares expression between two conditions (i.e. tumor versus control), which is one of the fundamental analysis in the transcriptomics data analytics workflow. For each comparison of two conditions (also called 'contrast'), the analysis identifies which genes are significantly downregulated or overexpressed in one of the groups.
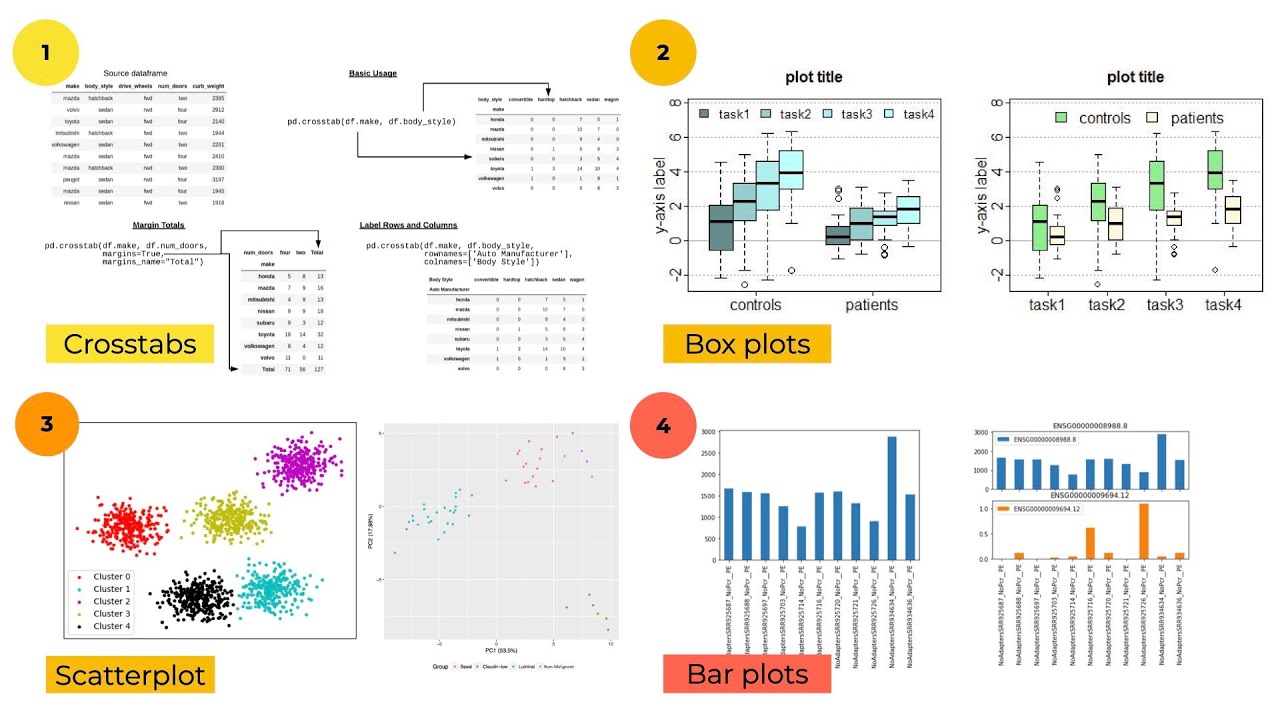
The Plots panel shows volcano and MA plots for the chosen contrast. It also shows the so-called 'signature', i.e. the top downregulated and overexpressed genes, for that contrast. The Top genes panel shows the average expression plots across the samples for top differentially expressed genes within the selected comparison. A very useful feature of the platform is that it can display volcano plots for all comparisons simultaneously under the Volcano (all) panel. This provides users an overview of the statistics of all comparisons. The Table panel on the bottom shows the results of the statistical tests. The Foldchange (all) panel reports the gene fold changes for all contrasts.
EXPERT MODE ONLY: To compare the different statistical methods, the Volcano (methods) panel shows volcano plots of all methods. The FDR table panel reports the number of significant genes at different FDR thresholds for all contrasts.
Повторяем попытку...

Доступные форматы для скачивания:
Скачать видео
-
Информация по загрузке: