How To Use Multiple Timeframes With Popular Indicators To Improve Your Analysis
Автор: TrendSpider
Загружено: 2020-01-22
Просмотров: 3849
Описание:
Multi-Timeframe analysis or MTFA can be game-changing when used properly. Jake from TrendSpider dives into some popular indicators and strategies to consider when analyzing multiple time frames to conduct your analysis in this edition of our Technical Analysis series.
Subscribe to our Youtube Channel for more great content! 👇
/ @trendspider
Try TrendSpider 7 Days Free! 👇
https://bit.ly/36DOZfp
What Do We Mean By Multiple Timeframes?
Timeframe in this context refers to the time for a single candle bar shown on your chart. For example, a 4-hour time frame chart will show price as a function of time in the form of 1 candlestick per 4 hour time period.
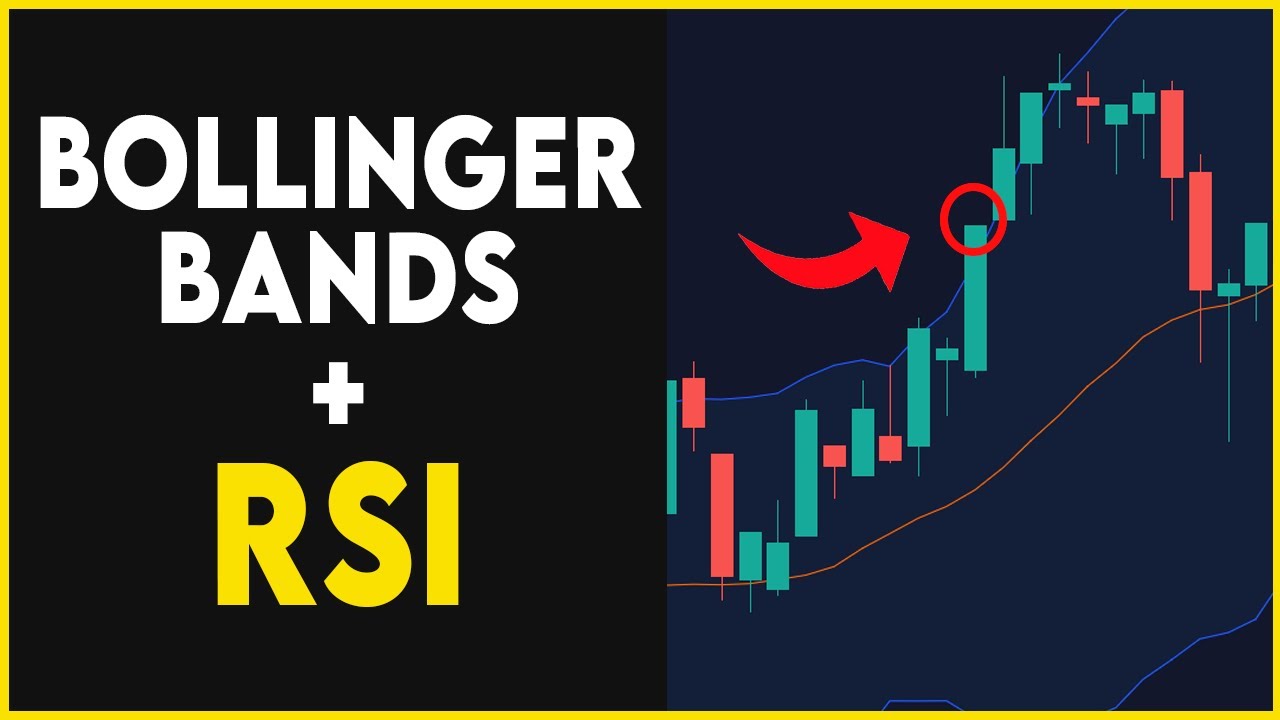
What is the Bollinger Band?
Bollinger Bands are a type of statistical chart characterizing the prices and volatility over time of a financial instrument or commodity, using a formulaic method propounded by John Bollinger
What is a Moving Average?
In statistics, a moving average is a calculation to analyze data points by creating a series of averages of different subsets of the full data set. It is also called a moving mean or rolling mean and is a type of finite impulse response filter. Variations include simple, and cumulative, or weighted forms.
Повторяем попытку...

Доступные форматы для скачивания:
Скачать видео
-
Информация по загрузке: