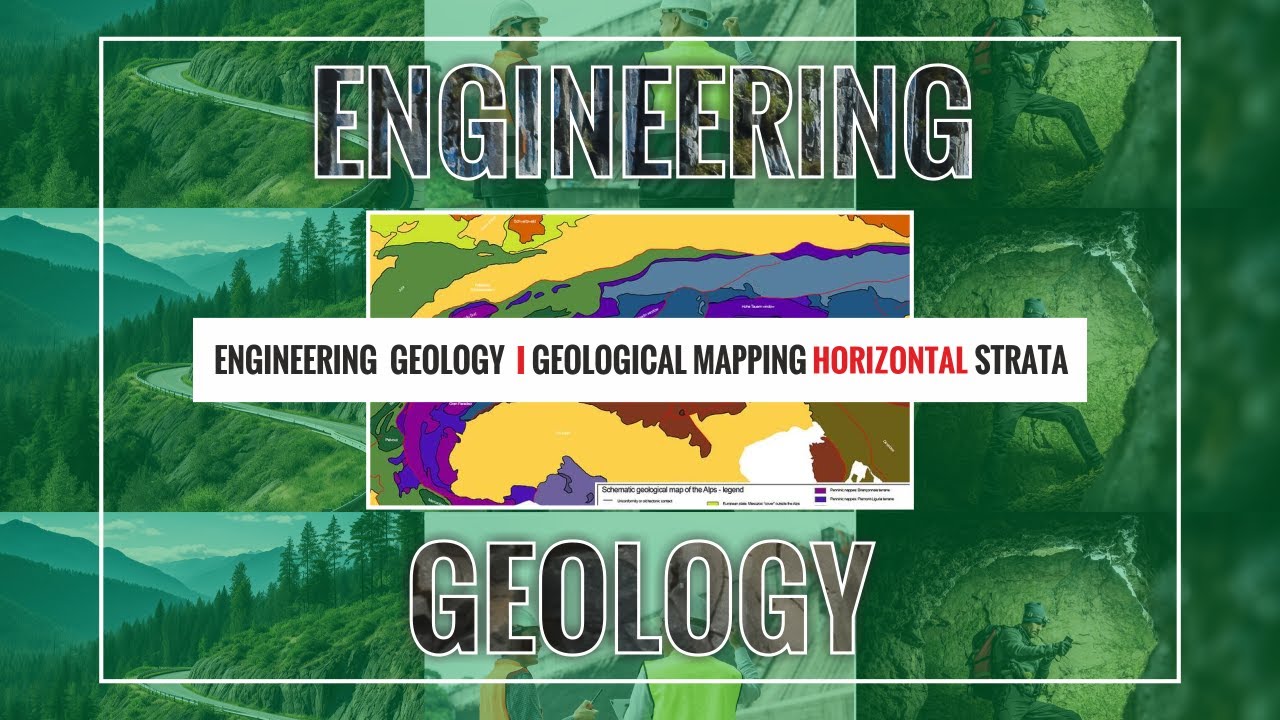
Engineering Geology | Geological Mapping | Horizontal Strata
Автор: Dr. Prabhin Sukumaran
Загружено: 2024-09-20
Просмотров: 218
Описание:
Basics of Geological Mapping
Geological mapping is a critical technique in understanding the distribution of different rock types, the structure of an area, and other geological features. In this material, we will go through the essentials of reading a geological map, identifying contours, and lithological boundaries, and creating a cross-sectional view of a region.
Understanding the Geological Map:
A geological map typically consists of two main features:
1. Solid Lines:
These represent lithological boundaries, which indicate the contact between different rock types. These boundaries are fixed and represent actual changes in rock composition. For example, the boundary between a sandstone layer and a conglomerate layer will be shown as a solid line.
2. Dotted Lines:
These represent contours, which are imaginary lines connecting points of equal elevation. Contours are shown as dotted lines because they are not fixed physical features. Each contour line is labeled with a value (e.g., 330 meters), indicating the elevation above sea level.
Lithological Boundaries vs. Contours:
Lithological Boundaries are solid because they indicate a tangible boundary between different rock layers. Geologists cannot alter these boundaries since they represent actual rock formations.
Contours are imaginary and can be altered in how they are drawn, which is why they are represented by dotted lines. For instance, if the contour interval is 60 meters, we can choose to plot contours at intervals like 330m, 270m, etc.
Analyzing the Geological Map:
When analyzing a geological map, the first step is to understand the contours and lithological boundaries. Identify the highest and lowest points by examining the contour values, and then determine which section of the map cuts across the maximum number of rock layers and contour lines. This helps in selecting the ideal area for geological sectioning.
Drawing a Geological Section:
To visualize the cross-sectional view of a region:
1. Choose a Line for the Section:
Select a line, say from point A to point B, that crosses the maximum number of rock layers and contour values. This line will represent the path along which you will create the cross-section.
2. Measure the Distance:
Measure the actual distance between points A and B on the map, which will represent the length of your section line.
3. Determine Elevations:
The highest and lowest elevations in the region will be marked by the contour values. For instance, if the highest point is at 330 meters and the lowest is at 150 meters, the cross-section will need to reflect this elevation range.
4. Scale for the Section:
For simplicity, we can assume that 1 cm on the section represents 60 meters of height. Using this scale, plot the elevations of all the contour points intersecting the section line.
5. Using a Paper Strip to Mark Contours:
A useful trick for marking contour intersections is to take a small strip of paper and lay it along the section line (A-B). Mark where each contour crosses the line and record the corresponding elevation. Then, transfer these marks onto your cross-section drawing.
Creating the Cross-Section:
Once you have transferred the contour points onto your section, draw a smooth line connecting these points. This line represents the natural surface of the landscape and should be drawn freehand, avoiding sharp, straight lines.
Plotting Lithological Contacts:
Next, plot the lithological boundaries on the cross-section:
1. Interpolate Rock Layers:
Based on the distances between contours, use an interpolation method to estimate the height at which lithological contacts occur. For example, if a rock layer boundary falls between 150m and 210m, you might estimate it to be at 180m.
2. Draw the Rock Contacts:
Once you have determined the heights, draw horizontal lines on the cross-section to represent the lithological boundaries. Ensure these lines only extend to the surface of the section.
Interpretation of the Geological Cross-Section:
After completing the cross-section, you can interpret several key features:
The number of rock layers present (A, B, C, D, etc.).
The maximum and minimum elevation of the area.
The gentle or steep slope of the region.
The absence of structural features like folds or faults (if all layers are horizontal).
Understanding the physical and mechanical properties of the rock types can help in making decisions related to construction, such as the suitability of a foundation for a dam.
Conclusion:
Geological mapping and cross-sectional analysis provide valuable insights into the composition and structure of the Earth's surface. By interpreting maps correctly, geologists can make informed decisions about land use, resource management, and construction projects.
Повторяем попытку...
Доступные форматы для скачивания:
Скачать видео
-
Информация по загрузке: