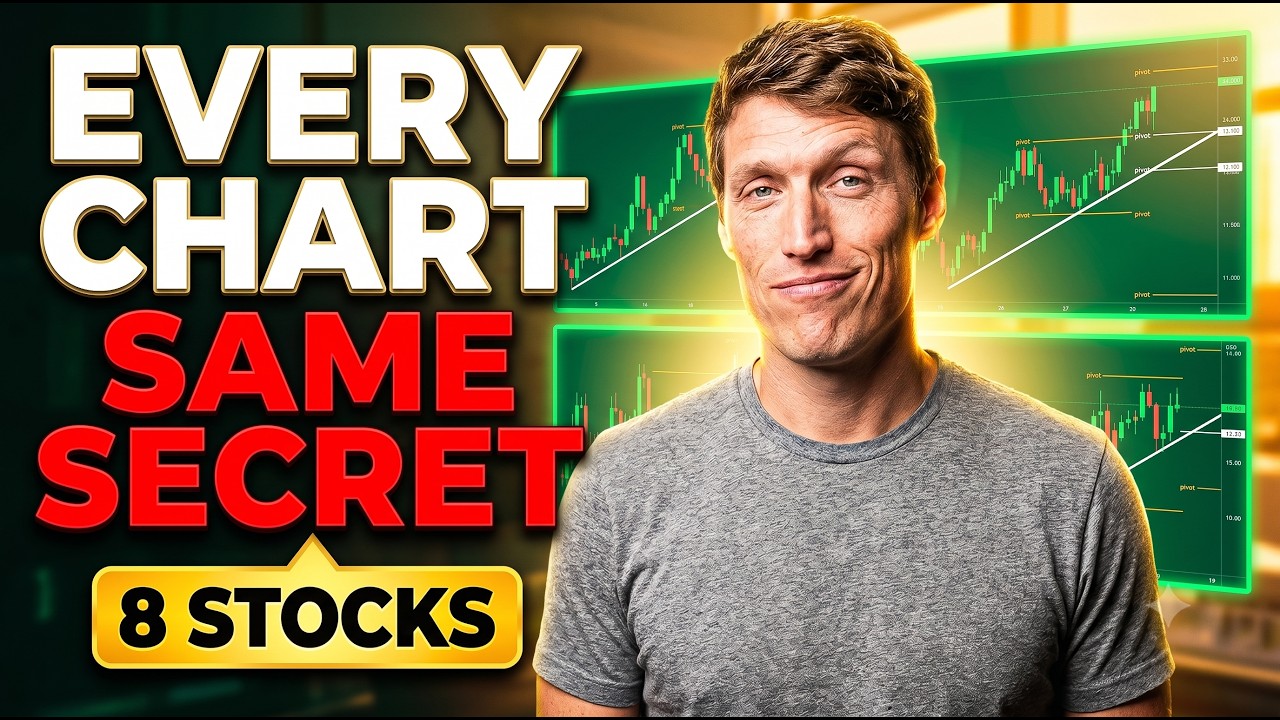
8 Stocks. One Framework. How to Find Trades on ANY Chart
Автор: Benjamin Pool
Загружено: 2026-06-14
Просмотров: 2275
Описание:
In this episode, I'm walking through 8 individual stock charts and showing you exactly how I identify high-probability support and resistance levels — and more importantly, how you can take this same framework and apply it to any stock you're watching. Whether you're a day trader or a swing trader, the methodology is the same: connect those pivot lows, identify where upsloping and downsloping trend lines converge, and let previous price action tell you where buyers and sellers are likely to step in.
Here's what I'm covering today:
📊 UAMY — Third touch of an upsloping trend line. This is where probabilities shift in favor of buyers. Here's exactly what I'm watching for a bounce and where I'd stop out if the trend line fails.
📊 TWLO (Twilio) — Forming what looks like a bear flag on top of trendline support. This is no-man's-land. I'm not going long, I'm not going short — I'll show you exactly what I need to see before I take action and what the short setup looks like if this breaks.
📊 LMND (Lemonade) — Converging trendlines forming a wedge. We've broken above the downsloping line but haven't confirmed continuation yet. I break down the ideal retrace entry and what this pattern could set up for on the next leg higher.
📊 SNOW (Snowflake) — Heavy overhead volume is my concern here. Even though technical levels suggest support, I explain why I'm skeptical of a bounce and what makes this chart more bearish than it looks on the surface. My first real buy level is at $183.58.
📊 TTD (The Trade Desk) — Relentlessly getting sold into on every relief bounce. But there is a line in the sand at $19.73 and a downsloping trend line overhead that, once recaptured, changes everything. Here's how I'm framing this trade.
📊 UBER — Lower highs, lower lows. Bearish structure developing. My swing trade long level is $60.66, but if that doesn't hold, I'll show you the next levels down and how to manage a dollar-cost-average approach if you want to build a position.
The key takeaway from this video: the ticker symbol doesn't matter. Whether it's UBER, LYFT, TSLA, or NVDA — the framework for reading support, resistance, trend lines, and volume is the same. Learn this, and you can apply it everywhere.
If you want me to break down a specific ticker you're watching, drop it in the comments — I go back and read every one of them.
📅 New episodes drop weekdays at 8:45 AM Eastern — never miss your pre-market edge.
@protraderbenjaminpool @garethsolowayprotrader
⚠️ DISCLAIMER: This video is for educational purposes only and should not be considered financial advice. Trading involves substantial risk of loss. Past performance is not indicative of future results. Always conduct your own research and consult a licensed financial professional before making any investment decisions.
#TechnicalAnalysis #SupportAndResistance #StockMarket #DayTrading #SwingTrading #TrendlineTrading #UAMY #TWLO #LMND #SNOW #TTD #UBER #BenjaminPool #VerifiedInvesting #TradingStrategy #StockMarket2026 #TradingEducation #ChartAnalysis
Повторяем попытку...
Доступные форматы для скачивания:
Скачать видео
-
Информация по загрузке: