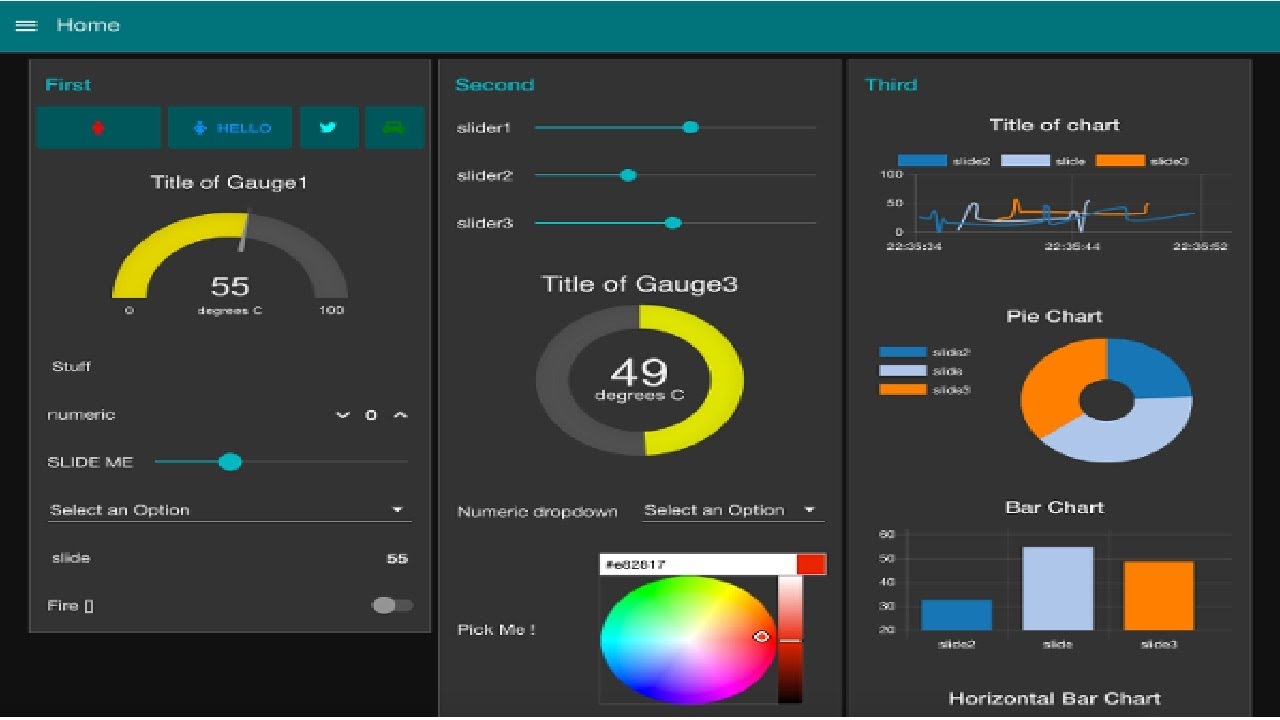
Node-Red Dashboard Displaying the reading sensor on the webserver
Автор: សុភាពត្បូងឃ្មុំ
Загружено: 2024-10-07
Просмотров: 424
Описание:
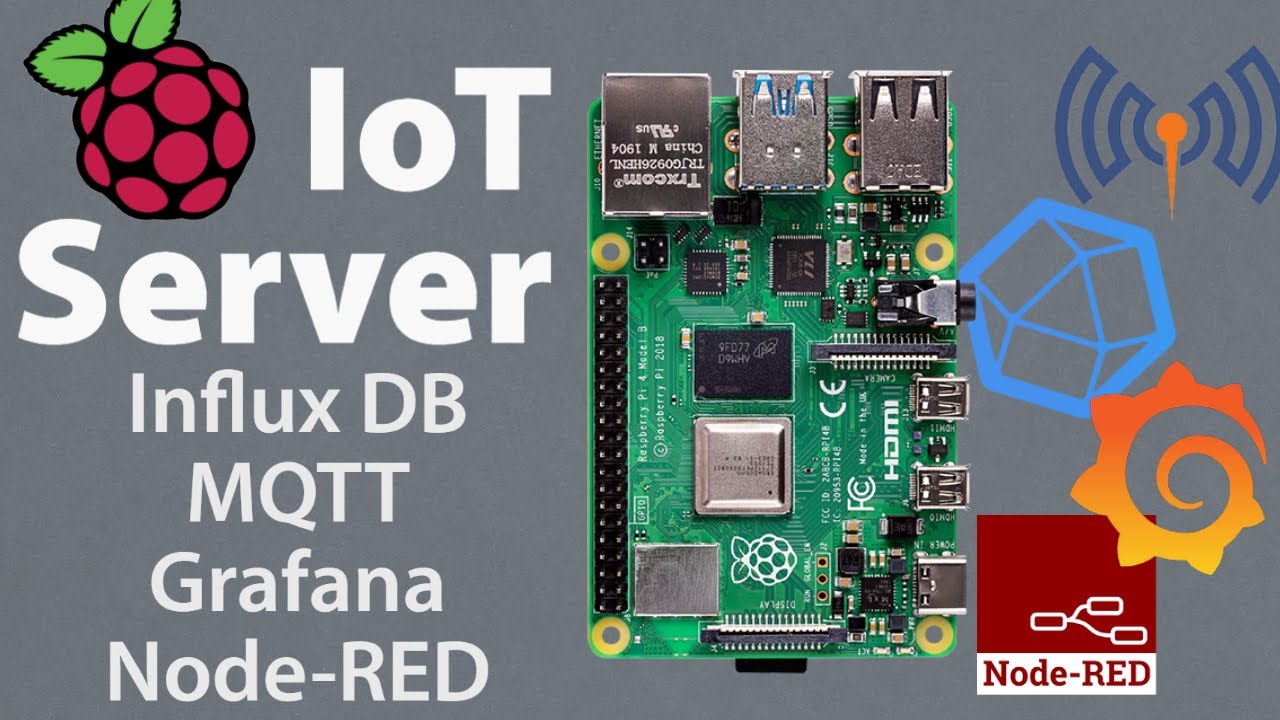
Welcome to our latest tutorial on using Node-Red to create a dynamic dashboard for displaying sensor readings on a web server! 🌐
In this video, we’ll guide you through the entire process, from setting up Node-Red on your Raspberry Pi to configuring your sensors and creating a visually appealing dashboard. Whether you’re a beginner or an experienced maker, this step-by-step guide will help you visualize your sensor data in real-time.
What you’ll learn:
Installing Node-Red on Raspberry Pi
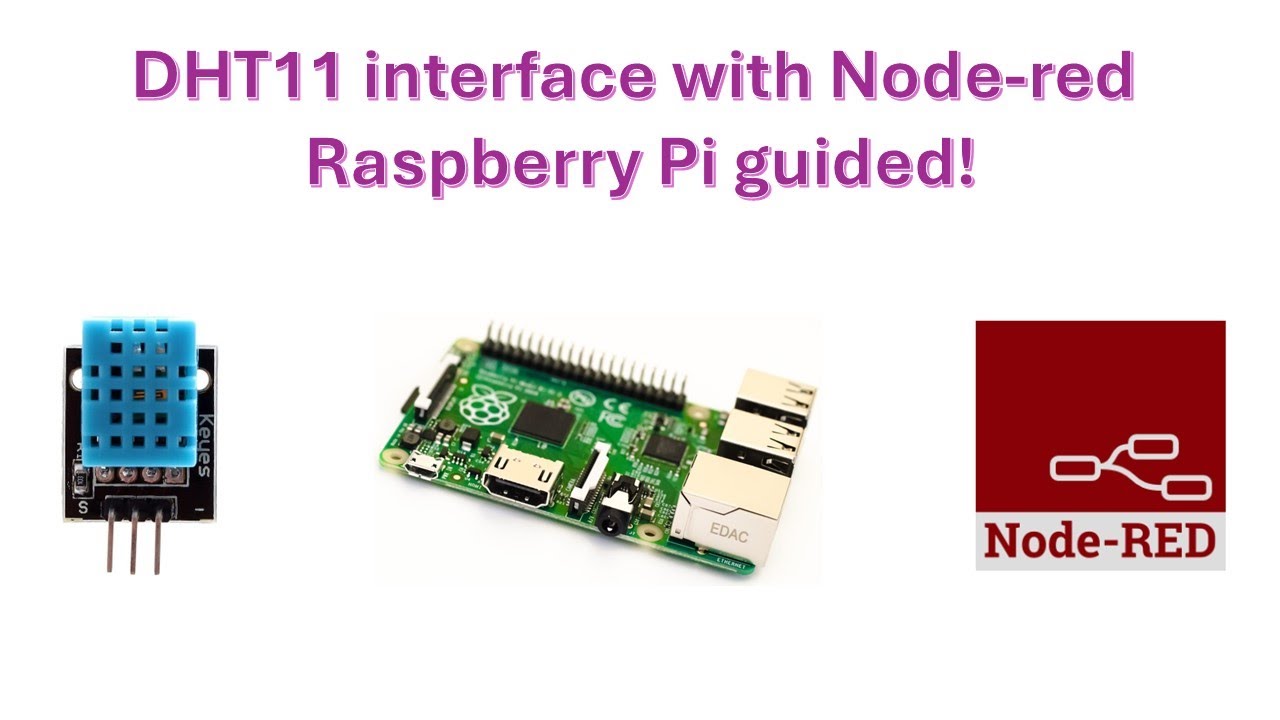
Connecting and configuring sensors
Creating and customizing a Node-Red dashboard
Displaying real-time sensor data on a web server
Why watch this video?
Easy-to-follow instructions
Practical examples and tips
Enhance your IoT projects with real-time data visualization
Don’t forget to like, comment, and subscribe for more tutorials on IoT, Raspberry Pi, and Node-Red! 👍🔔
Links & Resources:
Node-Red Official Website
Raspberry Pi Setup Guide
Sensor Documentation
Повторяем попытку...
Доступные форматы для скачивания:
Скачать видео
-
Информация по загрузке:


![Best of Deep House [2026] | Melodic House & Progressive Flow](https://imager.clipsaver.ru/Il-ZpBuC8tA/max.jpg)