Order vs Plot in Chemical Kinetics | Graphical Method Explained | IIT JEE JAM NEET Chemistry
Автор: One Chemistry
Загружено: 2025-08-27
Просмотров: 7931
Описание:
Order vs Plot in Chemical Kinetics
Introduction
In chemistry, chemical kinetics studies how fast a chemical reaction happens and what affects the speed. One important concept is the order of reaction, which tells us how the reaction rate depends on the concentration of reactants.
Sometimes, the order of a reaction can be determined using experimental plots, which are graphs of concentration versus time. This is called the graphical or plot method. Understanding how to use these plots helps students solve kinetics problems quickly and accurately.
Basics of Rate and Order
The rate of a reaction is how fast the concentration of a reactant decreases or how fast the product increases:
The order (n) can be 0, 1, 2, or fractional, and it affects how the rate changes as the concentration changes.
Graphical Method to Determine Order
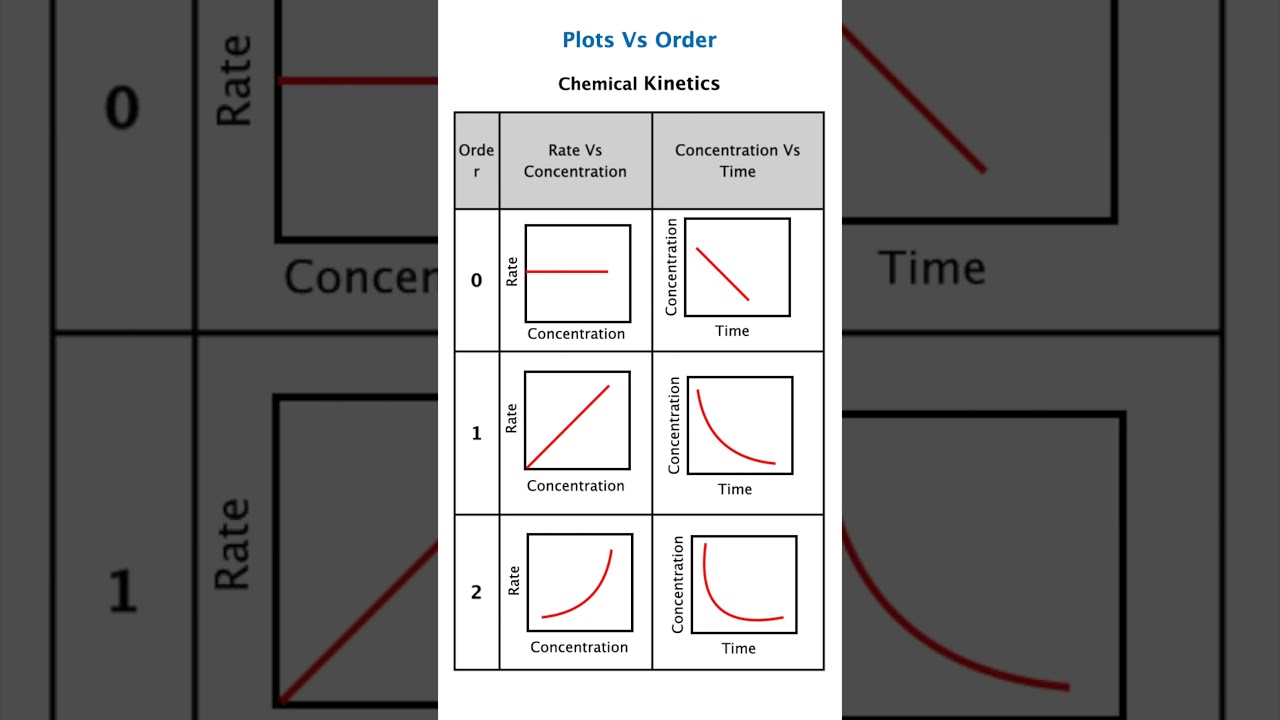
In the graphical method, we plot concentration data against time in different ways to determine the order of the reaction. The type of plot that gives a straight line indicates the order of the reaction.
1. Zero-Order Reaction
Concentration decreases linearly with time.
Plot: [A] vs time
A straight line with slope = -k
Integrated formula:
Conclusion: If [A] vs time gives a straight line, the reaction is zero-order.
2. First-Order Reaction
Rate law:
Concentration decreases exponentially with time.
Plots:
ln[A] vs time: Straight line with slope = -k
[A] vs time: Curved exponential decay
Integrated formula:
Conclusion: If 1/[A] vs time is straight, the reaction is second-order.
How to Solve Order vs Plot Questions
Collect concentration-time data from experiments.
Plot graphs:
[A] vs t
ln[A] vs t
1/[A] vs t
Check which plot is straight:
[A] vs t → zero-order
ln[A] vs t → first-order
1/[A] vs t → second-order
Calculate slope (k) from the straight line.
Use integrated formulas to calculate [A] at any time or to find half-life.
Tip: Always label axes correctly and check units of k:
Zero-order: M·s⁻¹
First-order: s⁻¹
Second-order: M⁻¹·s⁻¹
Advantages of the Graphical Method
Quick visual determination of reaction order
Easy to calculate rate constant (k)
Helps understand reaction kinetics without complex math
Useful in laboratory experiments and exam questions
Summary
Order of reaction determines how rate depends on concentration.
Plots help determine order quickly:
Zero-order: [A] vs time straight
First-order: ln[A] vs time straight
Second-order: 1/[A] vs time straight
Slope of plot = rate constant (k)
Integrated formulas allow calculation of [A] at any time.
Units of k depend on the order:
Zero-order: M·s⁻¹
First-order: s⁻¹
Second-order: M⁻¹·s⁻¹
By understanding Order vs Plot, students can solve all kinetics questions visually and accurately, making it easier to tackle exams and lab experiments.
Повторяем попытку...
Доступные форматы для скачивания:
Скачать видео
-
Информация по загрузке: