200 Week Moving Average Heatmap
Автор: Bitcoin Magazine Pro
Загружено: 2022-06-01
Просмотров: 1656
Описание:
Check out the 200 Week Moving Average Heatmap here:
https://www.lookintobitcoin.com/chart...
Subscribe to Look Into Bitcoin here:
https://www.lookintobitcoin.com/subsc...
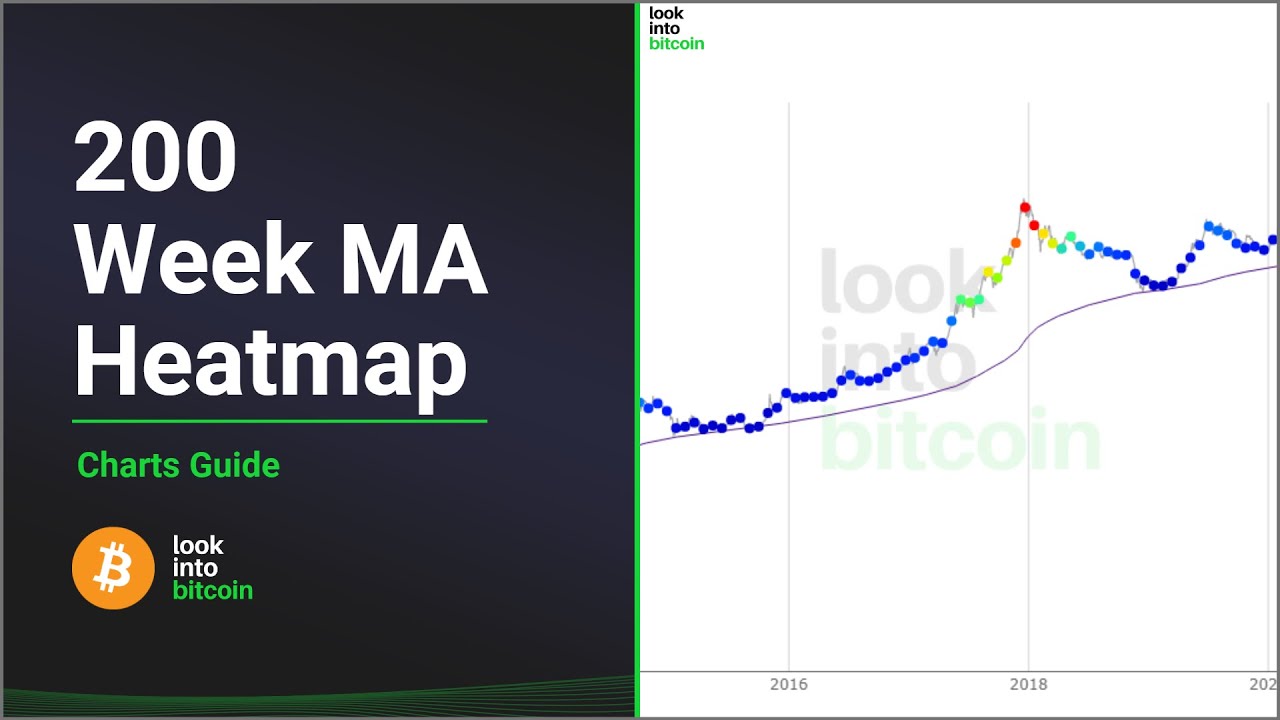
In each of its major market cycles, Bitcoin's price historically bottoms out around the 200 week moving average.
This indicator uses a colour heatmap based on the % increases of that 200 week moving average.
Depending on the month-by-month % increase of the 200 week moving average, a colour is assigned to the price chart.
If you are looking to predict the price of Bitcoin or forecast where it may go in the future, the 200WMA heatmap can be a useful tool as it shows on a historical basis whether the current price is overextending (red dots) and may need to cool down. It can also show when Bitcoin price may be good value on a historical basis. This can be when the dots on the chart are purple or blue.
Disclaimer:
Nothing within this video should be misconstrued as financial advice. The information provided is for educational purposes only. You are responsible for your own investment decisions.
Повторяем попытку...
Доступные форматы для скачивания:
Скачать видео
-
Информация по загрузке: