NEW Power BI Visual Calculations | Feb 2024 (Full Tutorial with PBIX Dashboard Included!)
Автор: Maven Analytics
Загружено: 2024-04-03
Просмотров: 7729
Описание:
Save up to 50% off Maven Pro Plans! ➡️ https://bit.ly/4cXXTHo
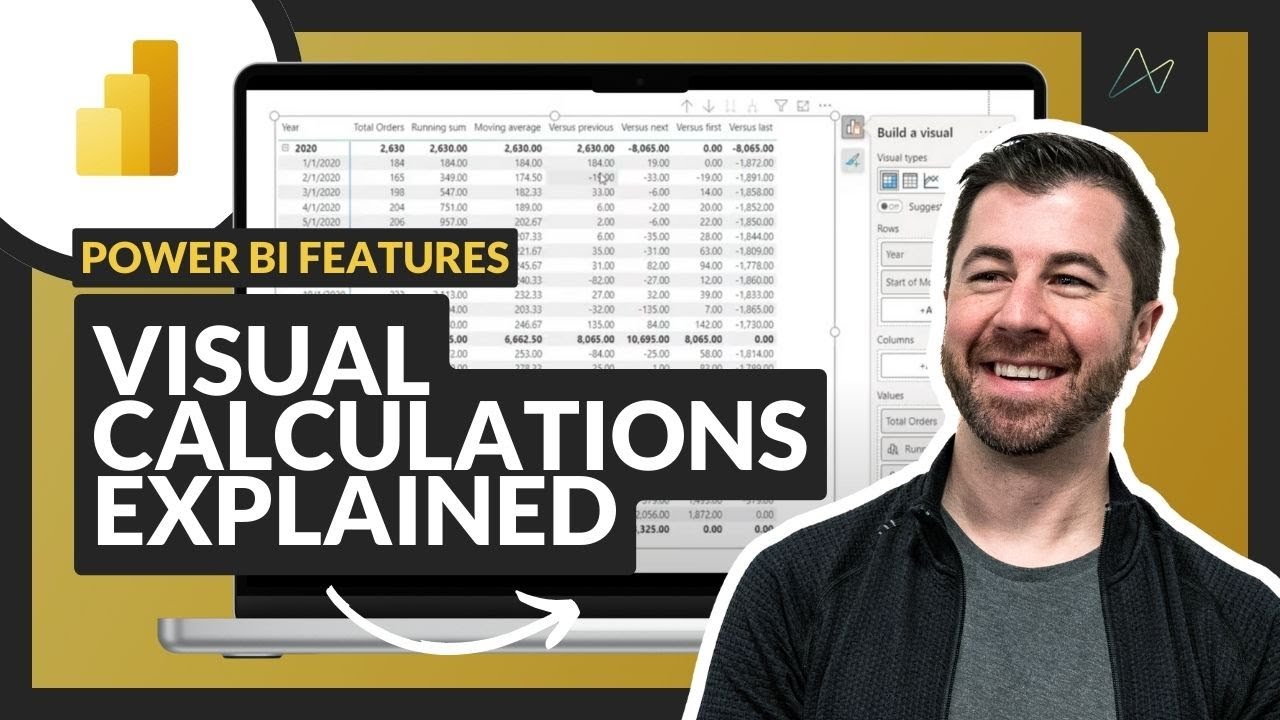
In this hands-on demo, Maven Analytics Founder Chris Dutton introduces Power BI’s brand new visual calculations (released to preview in February 2024).
We’ll break down exactly how visual calculations can be applied in Power BI Desktop, explore common use cases like running totals, percent of parent and positional reference calculations, then review some of the major pros and cons compared to traditional DAX measures and calculated columns.
As a bonus, you can follow along by downloading the same dashboard used in the demo, or build it yourself from scratch when you enroll in our best-selling Power BI Desktop course.
🎉 UP TO 50% OFF SPRING SAVINGS 🎉
AI is reshaping every industry, and the professionals who will thrive aren’t waiting to figure it out. They’re building real skills right now.
You can, too!
For Spring Savings, you can choose from 3 great offers through May 14th:
👉 Monthly plan: 25% off your first 3 months ($36.75/mo)
👉 Annual plan: 50% off your first year ($199.50/yr)
👉 Lifetime access: 50% off, forever ($849.50)
All Maven Pro memberships include:
✓ Unlimited access to ALL courses & learning paths
✓ Customized learning plans
✓ Guided projects
✓ Skills assessments
✓ Showcase portfolio builder
✓ Free practice data sets
✓ Private student dashboard
✓ Live instructor chat support
Plus something brand NEW, launching soon...👀
Build job-ready AI + data skills, all in one membership.
SAVE NOW 👉 https://bit.ly/4cXXTHo
🔗 Links to Resources:
👉AdventureWorks Power BI file (pbix):
https://maven-datasets.s3.amazonaws.c...
👉Maven Analytics Power BI Desktop course: https://mavenanalytics.io/course/micr...
👉Power BI February 2024 Feature Summary: https://powerbi.microsoft.com/en-us/b...
👉Microsoft Visual Calc Documentation: https://learn.microsoft.com/en-us/pow...
⏱️ Timestamps ⏱️
00:00 - Intro
00:43 - What are visual calculations?
02:05 - Key benefits of visual calcs
03:12 - Calculation templates
04:50 - DEMO: Running sum
05:52 - DEMO: Moving average
06:58 - DEMO: Positional references (Previous, Next, First, Last)
09:01 - Showing/hiding calculated fields
11:08 - Formatting visual calculations
12:21 - DEMO: Percent of parent
14:23 - DEMO: Percent of grand total
15:30 - DEMO: Average of children
17:23 - Modifying bar charts
19:19 - Pros & cons of visual calcs
At Maven Analytics we empower everyday people with life-changing data skills. Head to http://mavenanalytics.io and master in-demand tools like Excel, SQL, Power BI, Tableau, Python and more. Start learning for FREE!
Looking for more opportunities to sharpen your skills? Explore sample datasets hand-picked by Maven instructors, and practice solving real business problems with expert-led guided projects: https://mavenanalytics.io/guided-proj...
Happy learning!
Повторяем попытку...
Доступные форматы для скачивания:
Скачать видео
-
Информация по загрузке: