Скачать
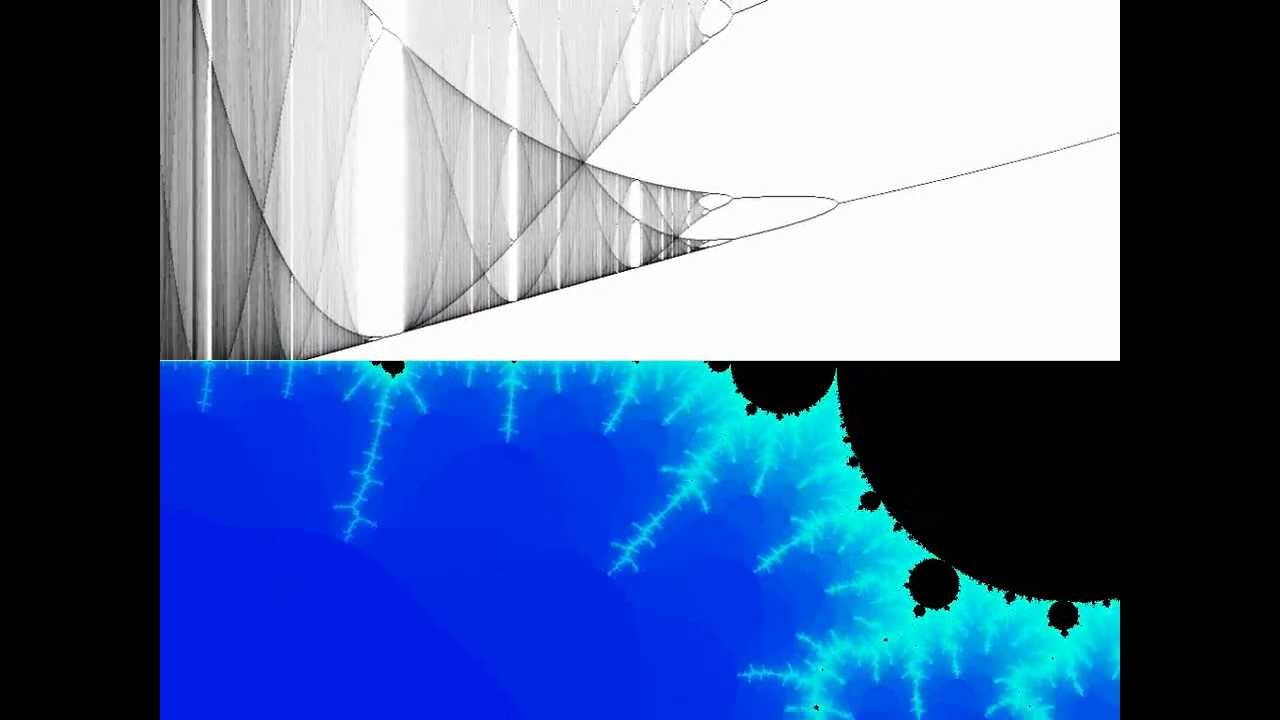
The Mandelbrot set together with its bifurcation diagram - zoom to magnification × 1,000,000,000
Автор: Logicedges
Загружено: 2012-05-18
Просмотров: 44687
Описание:
The beautiful Mandelbrot set shown next to its corresponding bifurcation diagram, illustrating how chaotic systems develop. The bifurcation tree relates to the map of the "logistic map zoom" video & can also be used to calculate the Feigenbaum constant, δ = 4.669 201… .
Further information at https://sites.google.com/site/logiced...
and how to plot various famous fractals at https://sites.google.com/site/logiced...
Не удается загрузить Youtube-плеер. Проверьте блокировку Youtube в вашей сети.
Повторяем попытку...
Повторяем попытку...
Доступные форматы для скачивания:
Скачать видео
-
Информация по загрузке: