Скачать
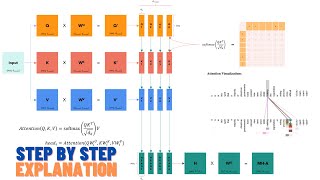
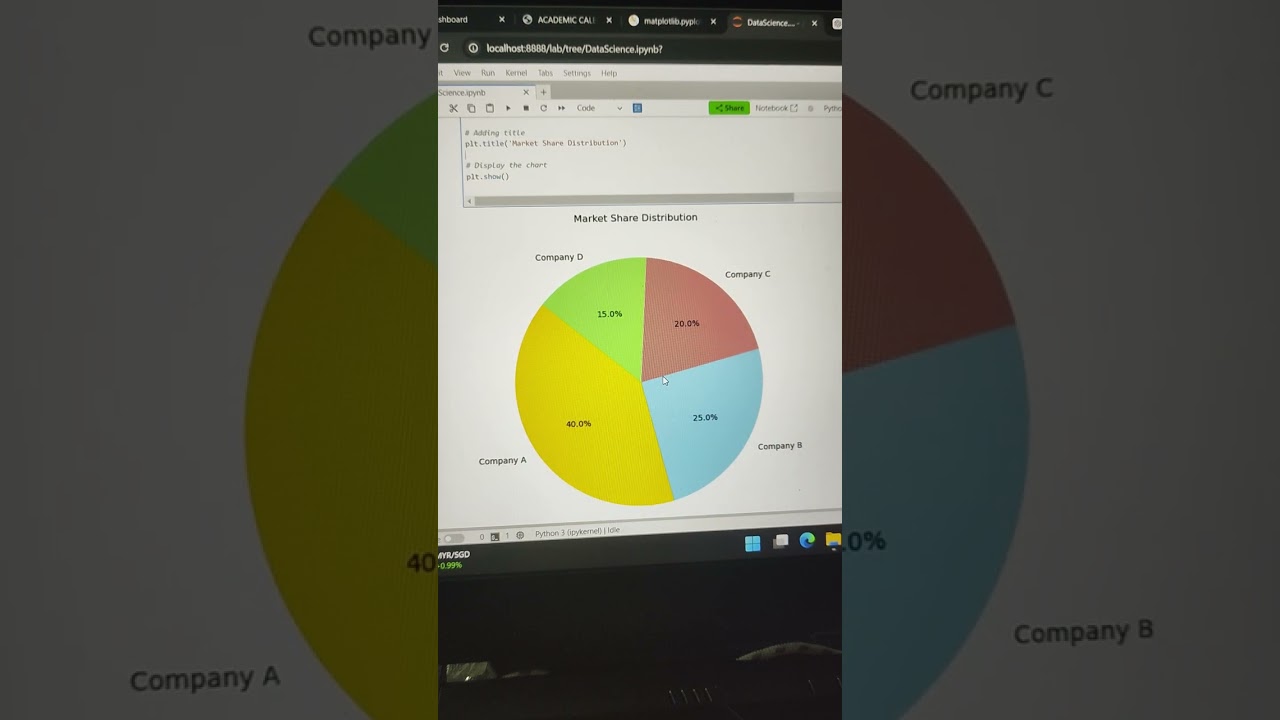
How to plot line, bar pie chart using Python: Matplolib & Numpy Tutorial
Автор: Aaron Lee
Загружено: 2024-09-17
Просмотров: 9
Описание: "In this video, I'll show you how to create line, bar, and pie charts using Python with the powerful matplotlib and numpy libraries. You'll learn how to visualize data trends, compare categories, and display proportions easily. This tutorial is perfect for beginners who want to understand the basics of data visualization in Python. Don’t forget to like, comment, and subscribe for more programming tutorials!"
Не удается загрузить Youtube-плеер. Проверьте блокировку Youtube в вашей сети.
Повторяем попытку...
Повторяем попытку...
Доступные форматы для скачивания:
Скачать видео
-
Информация по загрузке: