How to Read a Stock Chart for Earnings Season | MSFT Technical Analysis Tutorial
Автор: Martha Stokes CEO of TechniTrader
Загружено: 2025-10-01
Просмотров: 2631
Описание:
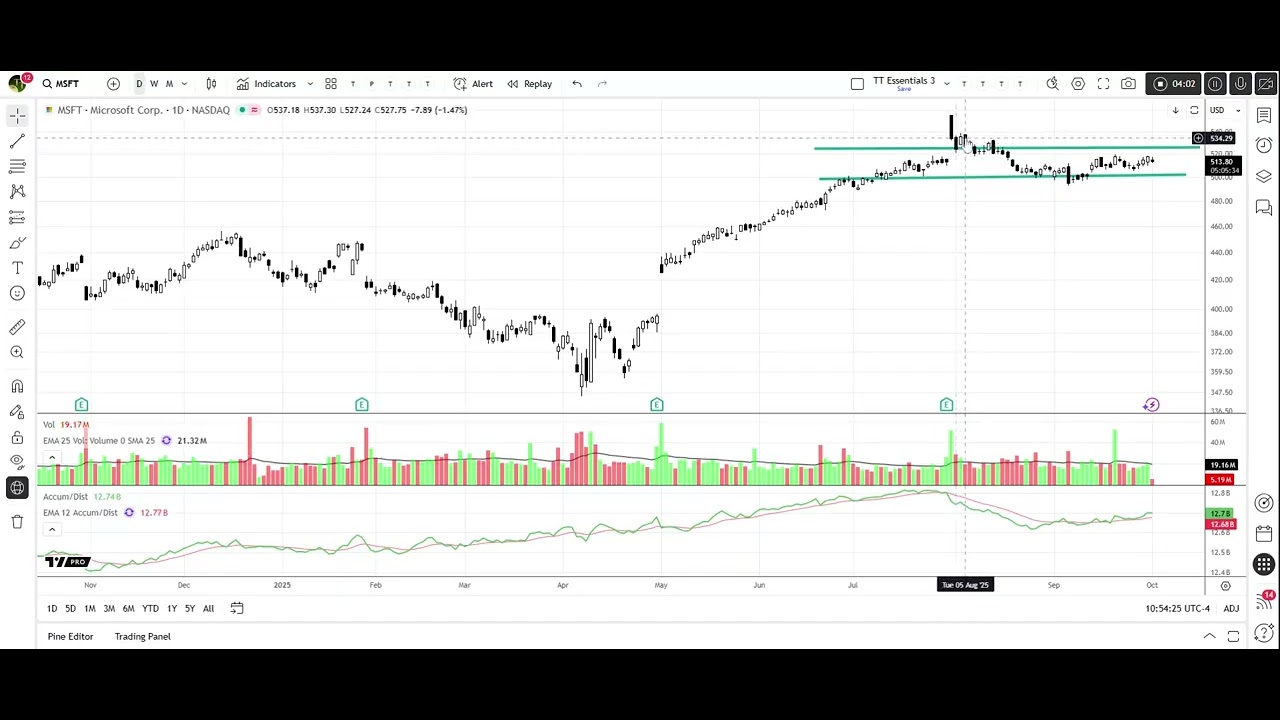
In this video, you’ll learn *how to study a stock chart for earnings season* using Microsoft (MSFT) as the example. We break down:
00:00 — Introduction & why chart analysis matters before earnings
01:15 — Identifying platform / consolidation zones
03:40 — Finding “buy zones” vs breakdown zones
05:50 — Dark pool & institutional order flow cues
08:10 — How to use chart signals for trade planning
10:30 — Final recap & tips for earnings weeks
🔍 *What you’ll get:*
• Step-by-step method to spot actionable patterns before earnings
• How to avoid chasing gap moves blindly
• Insight into institutional vs retail order behavior
• A framework you can apply to any stock, not just MSFT
If this helps, *like the video* and *subscribe* for more swing trading / technical analysis content. Drop a comment: what stock do you want me to chart next?
👉 Learn more: https://www.technitrader.com/
👉 Follow me: https://www.tradingview.com/u/MarthaS...
*Disclaimer:* This video is for educational purposes only and does not constitute financial advice. Always do your own research.
Повторяем попытку...
Доступные форматы для скачивания:
Скачать видео
-
Информация по загрузке:


![[2026] Feeling Good Mix - English Deep House, Vocal House, Nu Disco | Emotional / Intimate Mood](https://image.4k-video.ru/id-video/cxLdtvzf2sI)


