Скачать
Network Plot of Football Players Traded
Автор: OriginLab Corp.
Загружено: 2021-07-08
Просмотров: 1320
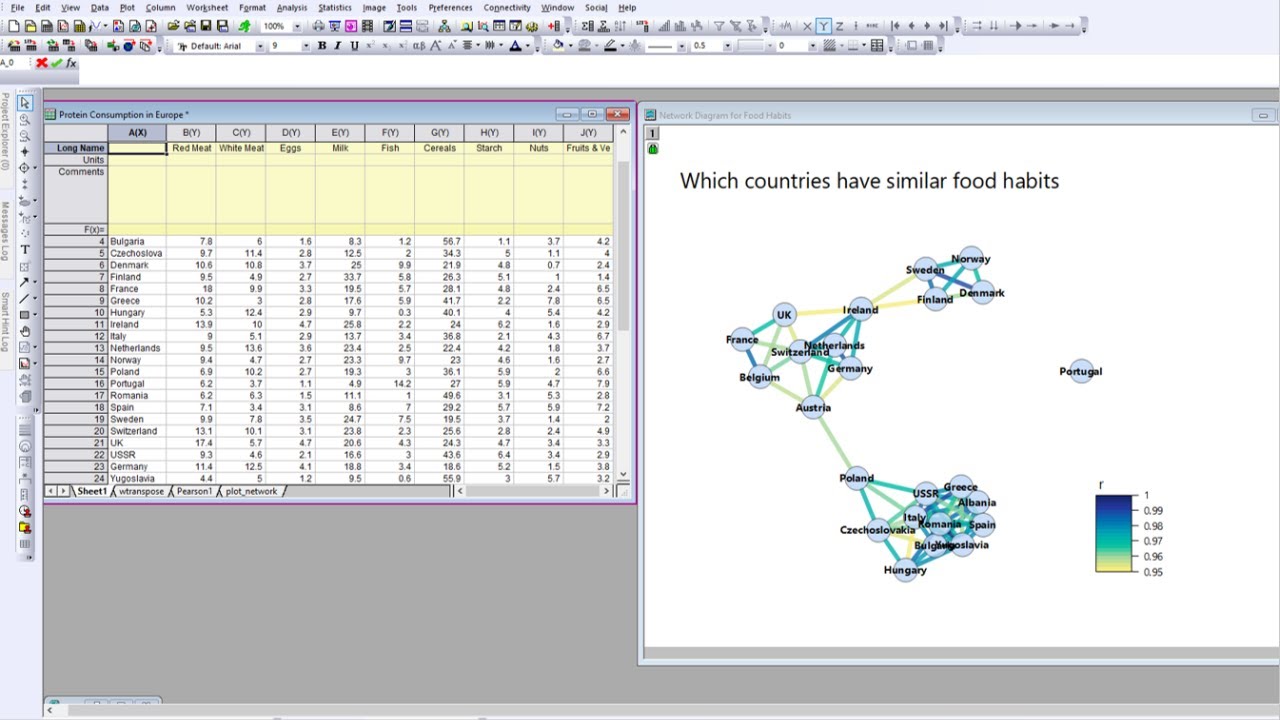
Описание: This video demonstrates how to make a Network Plot in Origin. The sample data used in this example is from football (soccer) players traded between countries in 1998. The data is arranged in an "Edge List" format; Column A is the country the player came "From", Column B is the country the player went "To", and Column C is the "Number of players traded". We will create a Network Plot with this data and then show how to further customize the nodes and links.
Не удается загрузить Youtube-плеер. Проверьте блокировку Youtube в вашей сети.
Повторяем попытку...
Повторяем попытку...

Доступные форматы для скачивания:
Скачать видео
-
Информация по загрузке: