Скачать
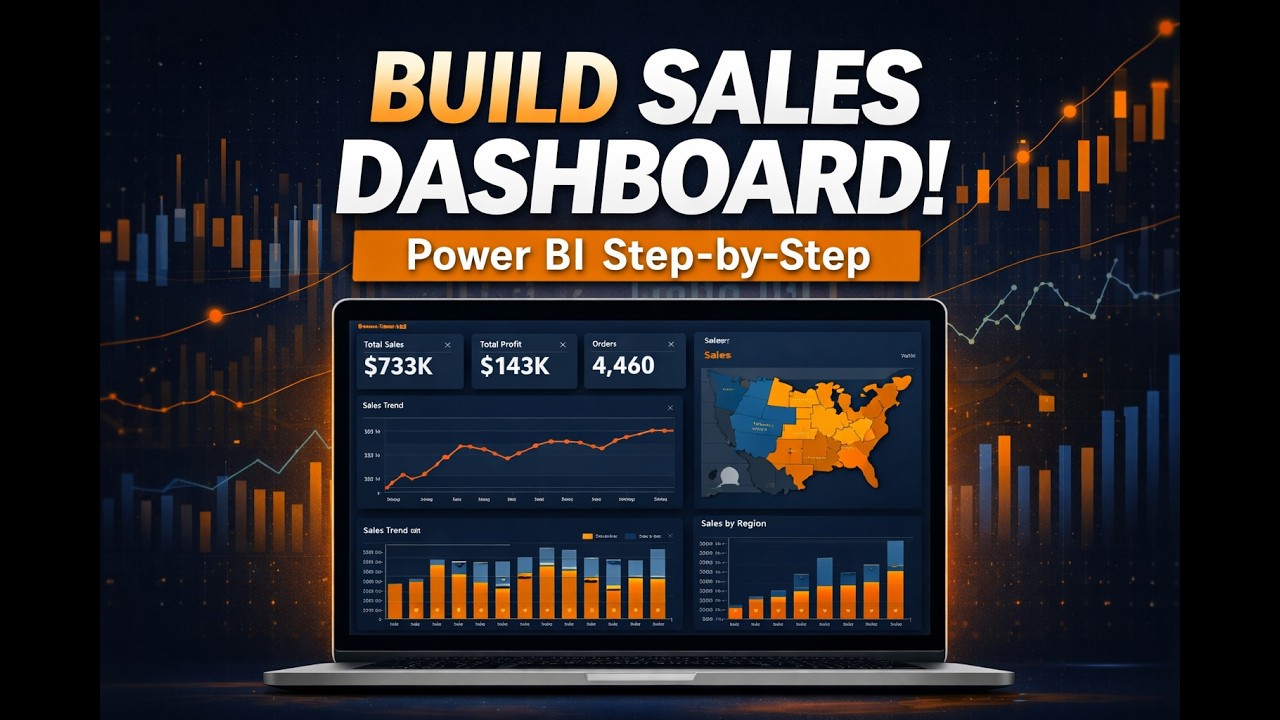
Creating an Interactive Sales Dashboard in Power BI | Retail Superstore Project
Автор: Pen Content Digital
Загружено: 2026-02-12
Просмотров: 1
Описание:
In this video, learn how to create an interactive Sales Performance Dashboard in Power BI using the Retail Superstore dataset.
We cover:
✔ Data cleaning & preparation
✔ Creating KPIs using DAX
✔ Sales & profit analysis
✔ Monthly trend visualization
✔ Regional sales insights
✔ Adding slicers and drill-through features
This beginner-friendly tutorial is perfect for data analytics students, business intelligence learners, and aspiring Power BI developers.
Build dashboards that tell a story and drive business decisions.
Need academic or project support?
📩 Contact PenContentDigital today.
Не удается загрузить Youtube-плеер. Проверьте блокировку Youtube в вашей сети.
Повторяем попытку...
Повторяем попытку...
Доступные форматы для скачивания:
Скачать видео
-
Информация по загрузке: