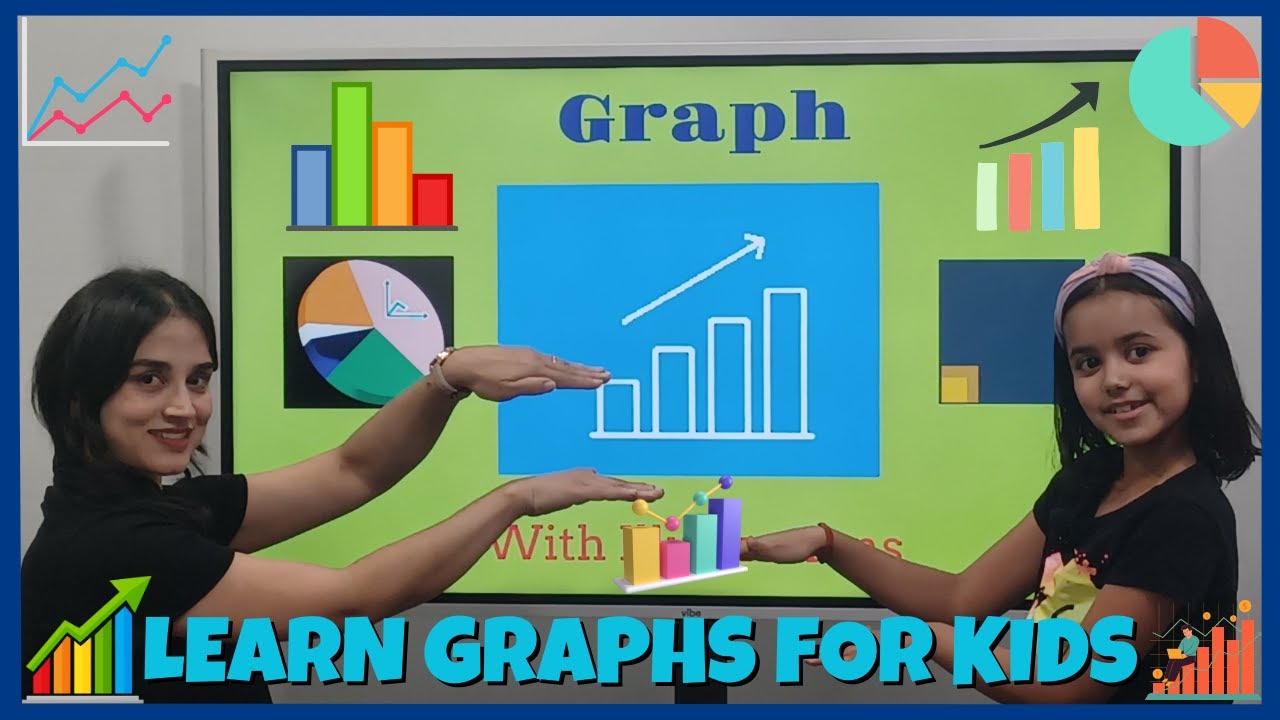
Different Type of Graphs for Kids | Parts of a Graph for Students | Analyzing Graphs for Grade 3 & 4
Автор: Leena Pretend Play
Загружено: 2023-09-09
Просмотров: 182
Описание:
In this comprehensive video, we will be diving deep into the fascinating world of graphs, tailored specifically for young learners in grade 3 and grade 4. The video is structured into four enriching sections to provide a holistic understanding of the subject. First, we will introduce the basic types of graphs such as bar graphs, line graphs, and pie charts, explaining their unique characteristics and ideal use cases. Second, we will break down the essential components of a graph, including the x-axis, y-axis, data points, and legends, to help students understand how to read graphs effectively. Third, we will guide students through the process of analyzing graphs, teaching them how to interpret data and draw meaningful conclusions. Finally, in the fourth section, we will share some engaging activities, games, and tips to make the learning process interactive and fun.
➤ What are different types of graphs?:
In this section, we will explore various types of graphs like bar graphs for comparing quantities, line graphs for tracking changes over time, and pie charts for showing parts of a whole. We will also introduce more advanced graphs like scatter plots and histograms, explaining when and how to use them effectively.
➤ What are different types of graphs?:
In this section, we will delve into the most commonly used types of graphs and their applications:
→ Bar Graphs: These are excellent for comparing quantities across different categories. Each bar represents a category, and the height of the bar indicates the value. Bar graphs can be vertical or horizontal and are often used in surveys and statistical reports.
→ Line Graphs: Ideal for showing trends over time, line graphs use points connected by lines to represent data. They are particularly useful for tracking changes in temperature, stock prices, or other variables that change over a set period.
→ Pie Charts: These are used to show parts of a whole. Each slice represents a category, and the size of the slice is proportional to its value in relation to the whole. Pie charts are great for showing market share or the composition of a population.
→ Histograms: Similar to bar graphs, histograms are used to represent frequency distributions. They are particularly useful for showing the distribution of a data set, like test scores in a class.
→ Scatter Plots: These are used to show the relationship between two variables. Each point on the graph represents a data pair. Scatter plots are often used in scientific research to identify correlations or trends.
→ Area Graphs: These are similar to line graphs but have the area below the line filled in, often with color. They are useful for showing quantities that accumulate over time, such as total revenue or population growth.
→ Pictographs: These use pictures or symbols to represent data. Each symbol represents a specific number of items, making the data easy to understand at a glance. Pictographs are often used in educational settings for younger audiences.
➤ This graph tutorial will apply to any student including:
→ Understanding graphs for grade 1,
→ Understanding graphs for grade 2,
→ Understanding graphs for grade 3,
→ Understanding graphs for grade 4,
→ Understanding graphs for grade 5
➤ Tags
#graphs #graphanalysis #typesofgraphs #education #learning #teacher #mathskills #datarepresentation #bargraphs #linegraphs #piecharts #grade3 #grade4 #math #maths #mathematics #visualdata #datavisualization #kidslearning, understanding graphs for kids, graph tutorials for grade 3, graph tutorials for grade 4, kids graph learning, graph practice for kids, educational video for graphs, numeracy skills for kids, learning graph facts for kids, graph fundamentals for kids, hands-on graph learning for kids, creative graph learning for kids, problem-solving skills in graph analysis, visual aids for learning graphs, graph puzzles for kids, mental math through graphs, graph challenges for kids, educational graph games for kids, graph fluency for kids, graph resources for kids, fun and engaging graph learning for kids, kid-friendly graph learning, graphs for beginners (kids), graph analysis strategies for kids, learn different types of graphs, graph facts for kids, practice analyzing graphs, teaching graphs to kids, fun ways to learn graphs, interactive graph activities, learning to read graphs, mastering graph analysis, visual aids for learning graphs, engaging activities for learning graphs, memorizing graph types, step-by-step guide to graph analysis, boosting graph skills, printable worksheets for learning graphs, fun songs for learning graphs, exploring different graphs, strategies for learning graph analysis, fun and interactive graph activities, mastering graph analysis through play, graph charts for learning, building fluency in graph analysis, tips for teaching graphs, interactive apps for learning graphs, mastering graph analysis through repetition, creative ways to learn graphs
Повторяем попытку...
Доступные форматы для скачивания:
Скачать видео
-
Информация по загрузке: