Excel Sales Data Analysis | Sales Dashboard Walkthrough (Data Analyst Project)
Автор: Data with Ridwan
Загружено: 2026-03-12
Просмотров: 23
Описание:
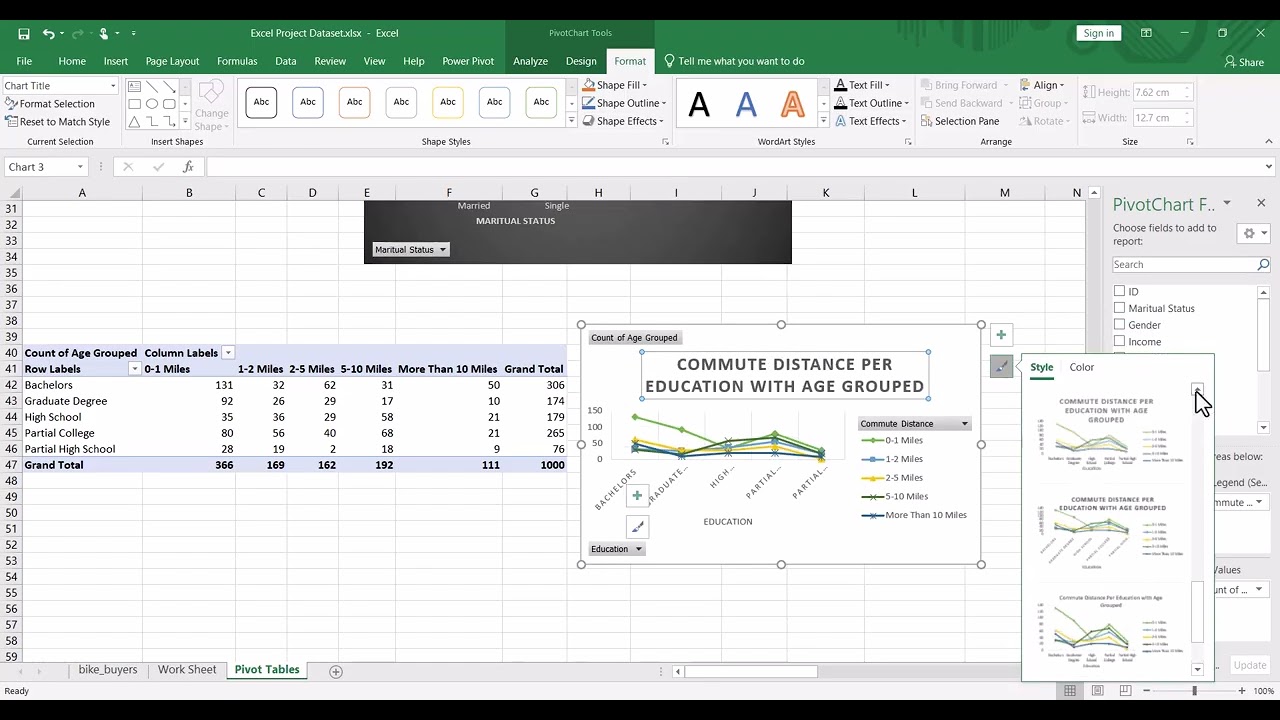
In this video, I present a complete Sales Data Analysis project using Microsoft Excel.
This walkthrough shows how sales data can be transformed into meaningful business insights using a dashboard.
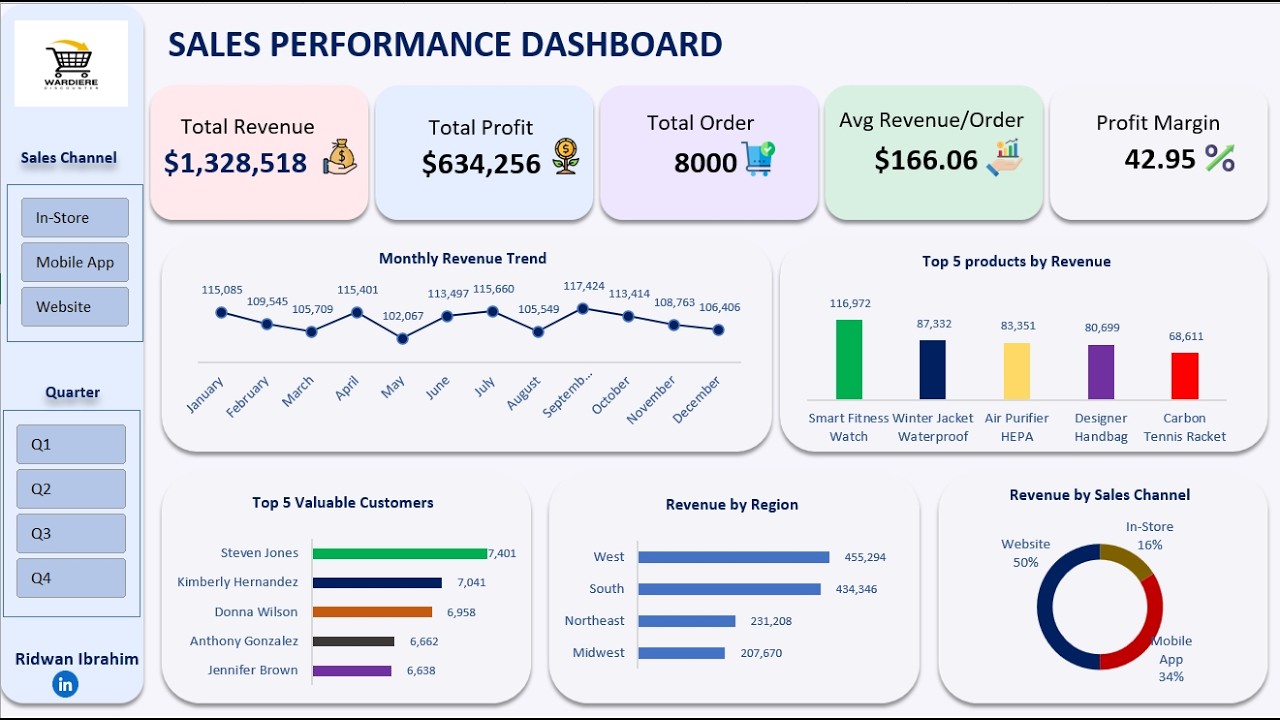
In the video, you will see:
• Business questions used for the analysis
• The dataset used for the project
• Key metrics such as revenue, profit, and orders
• Monthly revenue trends
• Top products by revenue
• Top customers
• Revenue by region
• Sales channels performance
This project demonstrates how data analysts present insights to stakeholders using dashboards.
Tools used:
Microsoft Excel
If you're learning Data Analysis and building your portfolio, this type of project can help showcase your analytical and visualization skills.
In future videos, I will explain step-by-step how this dashboard was built in Excel.
Subscribe for more tutorials on:
Excel for Data Analysis
SQL
Power BI
Python
Data Visualization
Business Intelligence
#Excel
#DataAnalysis
#ExcelDashboard
#DataAnalytics
#SalesAnalysis
#Dashboard
Повторяем попытку...
Доступные форматы для скачивания:
Скачать видео
-
Информация по загрузке: