ycliper

Популярное

Музыка Кино и Анимация Автомобили Животные Спорт Путешествия Игры Юмор

Интересные видео

2025 Сериалы Трейлеры Новости Как сделать Видеоуроки Diy своими руками

Топ запросов

смотреть а4 schoolboy runaway турецкий сериал смотреть мультфильмы эдисон
Скачать

Learn Regression Forms & Simulate Household Data in Mathematica (Intro to Econometrics)

Автор: EduByAmjad

Загружено: 2025-05-01

Просмотров: 153

Описание: 
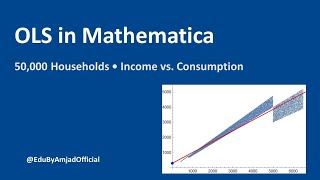
🔍 Introduction to Simple & Multiple Regression and Generating Household Data in Mathematica

In this tutorial, we introduce simple and multiple regression. Using Wolfram Mathematica, we demonstrate how to generate household-level data to be used for regression models, providing a practical approach to econometric analysis.​

📚 Topics Covered:

Introducing simple and multiple regressions

Interpreting regression parameters

Generating household data in Mathematica

This video is ideal for students and professionals in Economics, Econometrics, Macroeconomics, Microeconomics, Statistics, and related fields seeking to enhance their analytical skills using Mathematica.​

📌 Keywords:
#RegressionAnalysis #Econometrics #HouseholdData #SimpleRegression #MultipleRegression #EconomicsTutorial #DataAnalysis #StatisticsForEconomics #Macroeconomics #Microeconomics
#MathematicaTutorial #ProgrammingForEconomists #EducationalContent #EduByAmjad #LearnEconometrics #Economics

🔔 Stay Connected:
Subscribe to @EduByAmjadOfficial for more educational content on econometrics and data analysis.

Не удается загрузить Youtube-плеер. Проверьте блокировку Youtube в вашей сети.
Повторяем попытку...
Learn Regression Forms & Simulate Household Data in Mathematica (Intro to Econometrics)

Поделиться в:

Доступные форматы для скачивания:

Скачать видео

  • Информация по загрузке:

Скачать аудио

Похожие видео

Exploring Subsamples in Regression Analysis with Mathematica | EdyByAmjad

Exploring Subsamples in Regression Analysis with Mathematica | EdyByAmjad

Profit & Loss in Perfect Competition Explained | Shutdown, Normal & Supernormal Profit

Profit & Loss in Perfect Competition Explained | Shutdown, Normal & Supernormal Profit

OLS Regression in Mathematica: Estimating Income-Consumption Line for 50,000 Households

OLS Regression in Mathematica: Estimating Income-Consumption Line for 50,000 Households

Consumer & Producer Surplus Visualization with Linear Demand and Supply Curves in Mathematica

Consumer & Producer Surplus Visualization with Linear Demand and Supply Curves in Mathematica

Lagrange Multipliers Explained Visually | 3D Constrained Optimization in Mathematica

Lagrange Multipliers Explained Visually | 3D Constrained Optimization in Mathematica

Econometrics // Lecture 2:

Econometrics // Lecture 2: "Simple Linear Regression" (SLR)

LLM и GPT - как работают большие языковые модели? Визуальное введение в трансформеры

LLM и GPT - как работают большие языковые модели? Визуальное введение в трансформеры

Максимальное унижение Зеленского

Максимальное унижение Зеленского

Learn Regression Analysis in Excel in Just 12 Minutes

Learn Regression Analysis in Excel in Just 12 Minutes

Afternoon Jazz 🎷 [jazz lofi]

Afternoon Jazz 🎷 [jazz lofi]

© 2025 ycliper. Все права защищены.


  • Контакты
  • О нас
  • Политика конфиденциальности


Контакты для правообладателей: [email protected]