Скачать
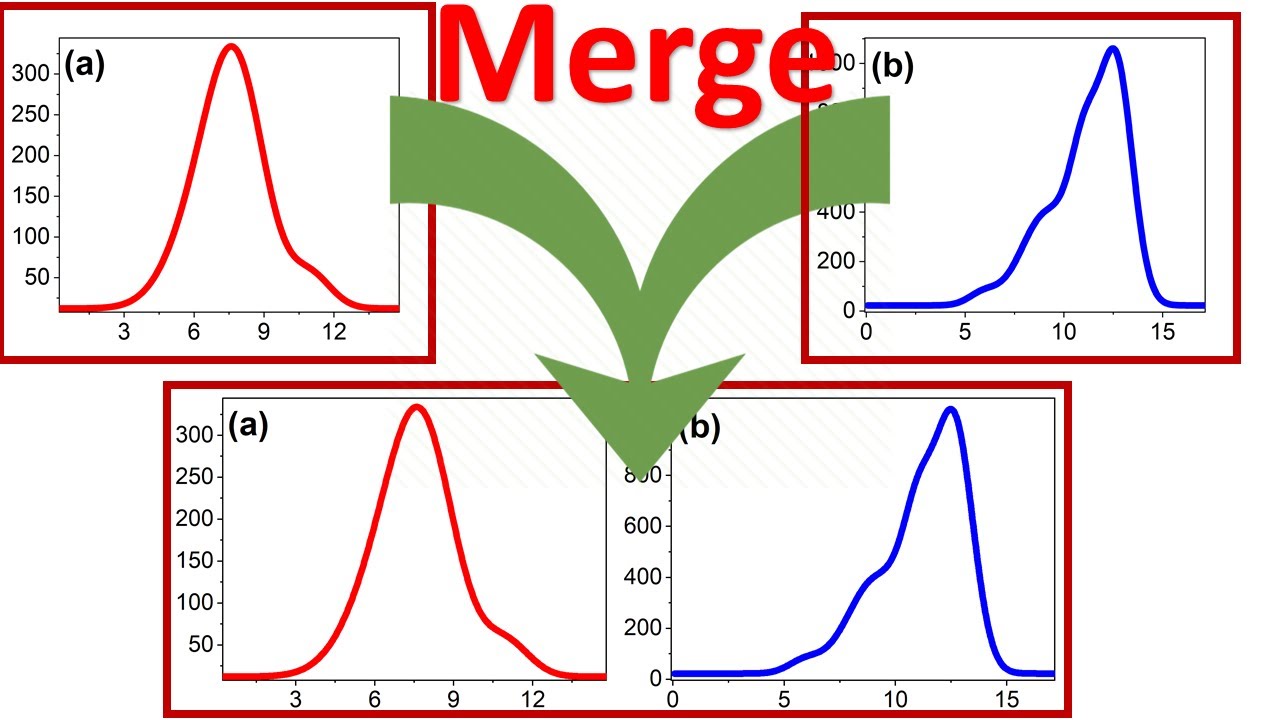
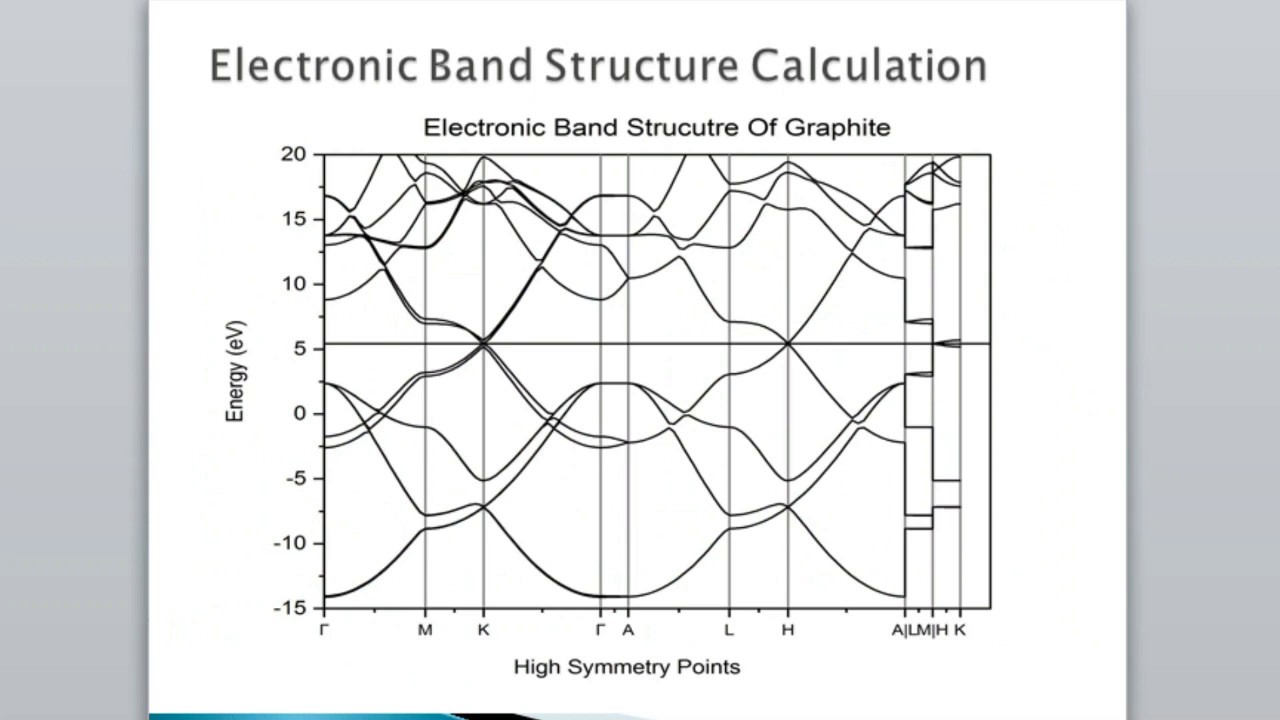
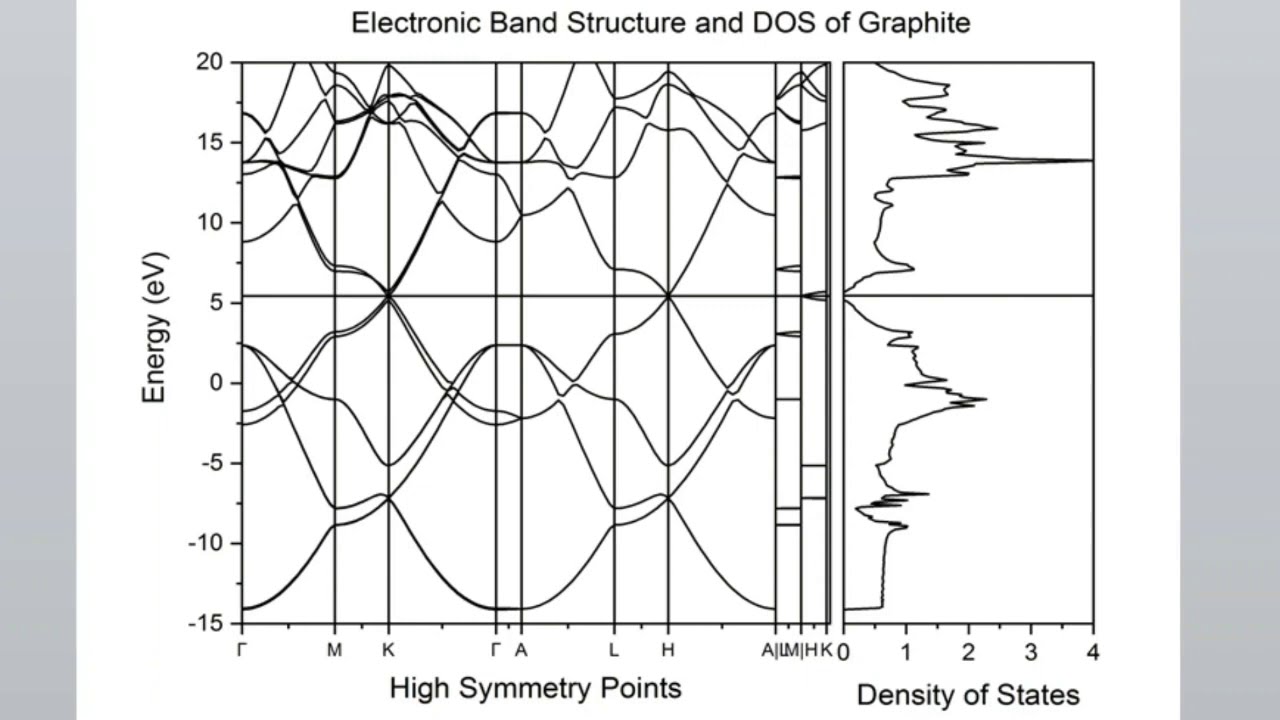
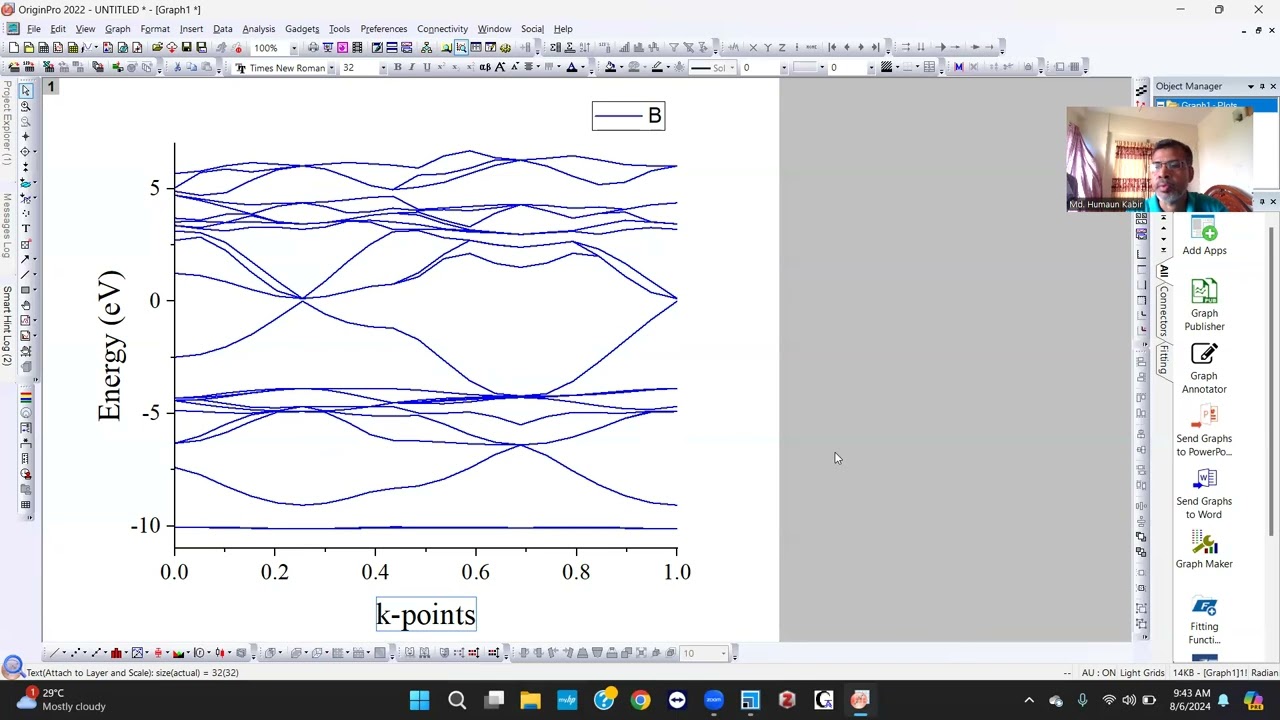
Plotting band structure using ORIGIN from CASTEP or DMoL3
Автор: Global Educational Equality School
Загружено: 2024-08-05
Просмотров: 1135
Описание: How to process graph by ORIGIN from CASTEP or DMoL3 data
Не удается загрузить Youtube-плеер. Проверьте блокировку Youtube в вашей сети.
Повторяем попытку...
Повторяем попытку...
Доступные форматы для скачивания:
Скачать видео
-
Информация по загрузке: