Power BI Maritime Logistics Dashboard | Data DNA Challenge Walkthrough
Автор: Zefas Bi and Analytics
Загружено: 2026-03-14
Просмотров: 231
Описание:
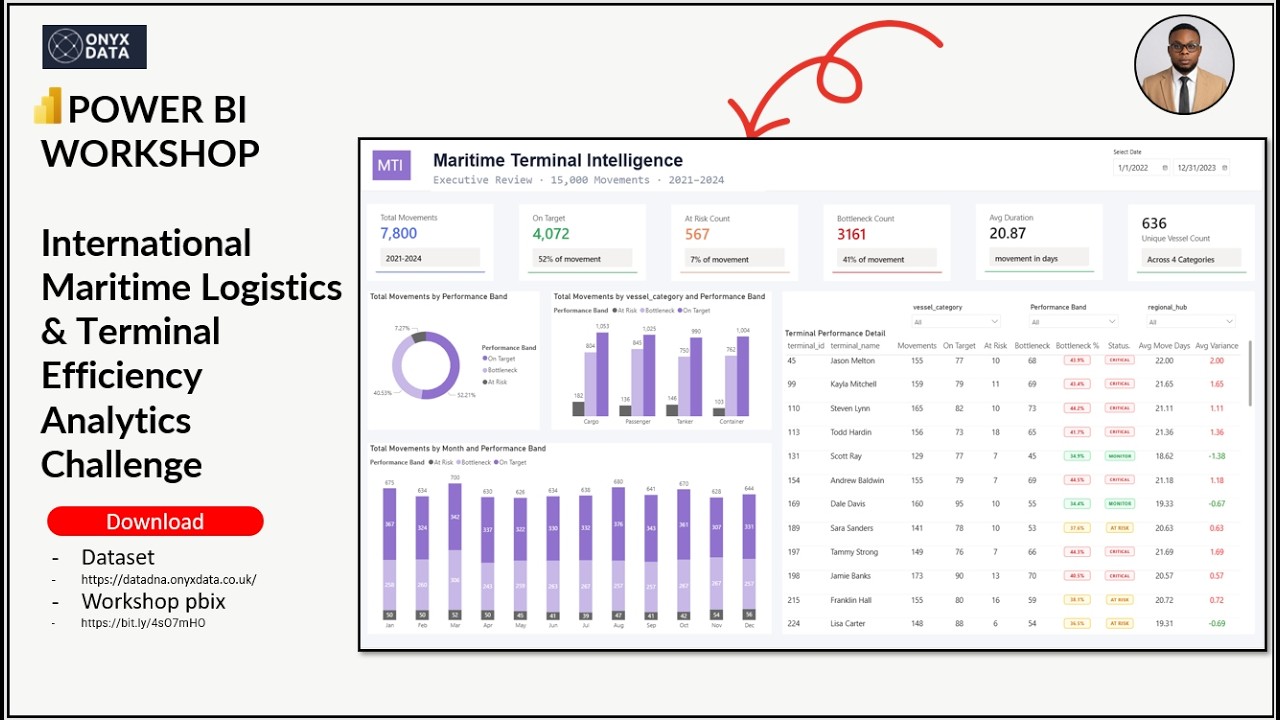
In this video, I walk you through a sample Power BI dashboard built on the International Maritime Logistics & Terminal Efficiency Analytics Challenge dataset — 15,000 movements across the Osnabrück → Bremerhaven corridor, 2021–2024.
This is a heads-up for anyone looking to participate in the challenge. You'll see how to structure your analysis around terminal performance, vessel categories, and movement efficiency bands — On Target, At Risk, and Bottleneck.
What's covered:
✅ KPI strip — Total Movements, On Target, At Risk, Bottleneck Count, Avg Duration
✅ Performance Band breakdown by vessel category
✅ Monthly movement trend by band
✅ Terminal Performance Detail table with SVG status badges
✅ Date range slicer for dynamic filtering
Dataset: 15,000 movements · 2021–2024
Tool: Microsoft Power BI Desktop
👉 Join the Data DNA Challenge and submit your own dashboard!
👉 Download Dataset - https://datadna.onyxdata.co.uk/
👉 Download Workshop pbix - https://drive.google.com/drive/folder...
NOTE
For My Complete PBIX Single Page Summary
Click To Download - https://mainstack.com/power-bi-mariti...
#PowerBI #DataDNA #MicrosoftFabric #DataVisualization #MaritimeLogistics #Dashboard
Повторяем попытку...
Доступные форматы для скачивания:
Скачать видео
-
Информация по загрузке: