Stochastic Momentum Index Indicator
Автор: InformedTrades
Загружено: 2013-12-11
Просмотров: 52959
Описание:
Access the Ultimate Oscillator Indicator via the Forex platform: http://tracking.leadfinance.com/SH3m
Join us in the discussion on InformedTrades:
http://www.informedtrades.com/1138721...
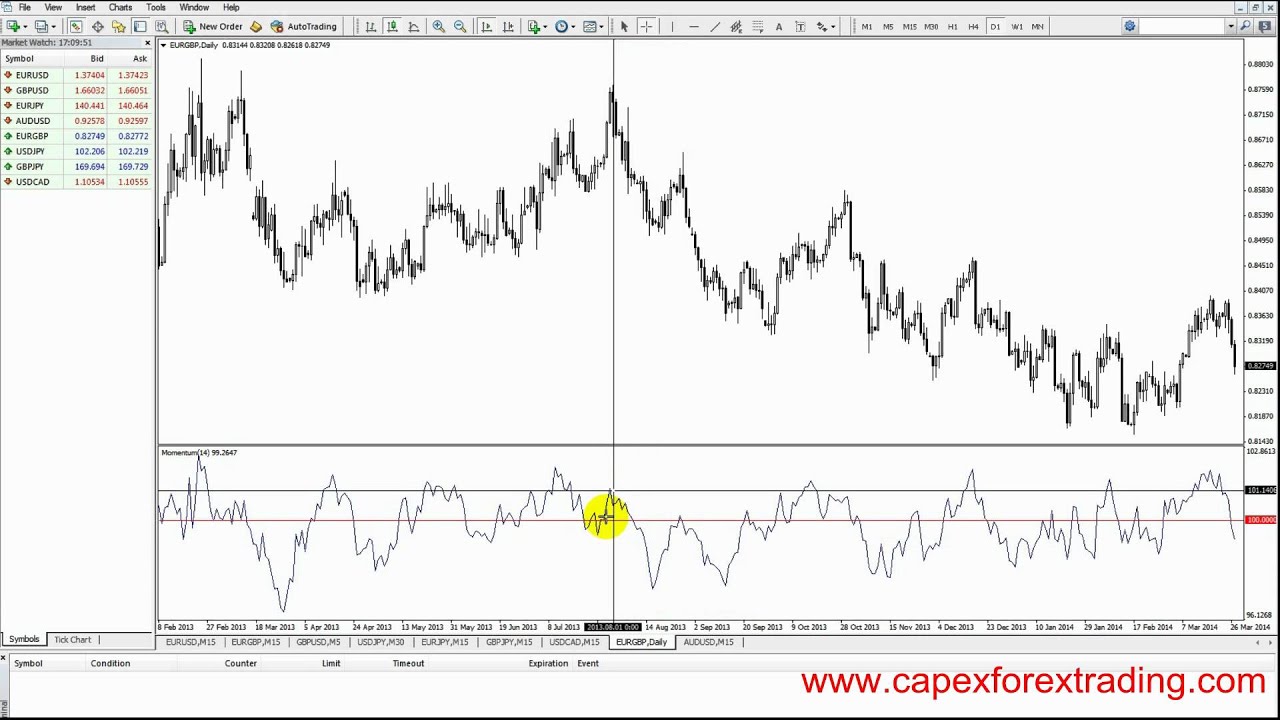
KEY POINTS REGARDING THE STOCHASTIC MOMENTUM INDEX
Introduced by William Blau in 1993 as a faster, less erratic version of the traditional stochastic oscillator
Evaluates the Current Close relative to the midpoint of the Recent High/Low Range instead of simply the High and Low, and graphs this value along with a moving average (Stochastic %D)
Helps predict turning points and duration of current price move
Best used alongside a way to predict trendiness of market (like Chande Momentum Oscillator or R-Squared); like other oscillators, the indicator calculates the direction of an emerging trend, but does not generate reliable signals in a trending market
CALCULATING THE STOCHASTIC MOMENTUM INDEX
First select a period N; then, determine the center (C) of the range during this period by adding the highest high and lowest low within the period and dividing the sum by 2
C = (HMAX + LMIN)/2
Now subtract this C from the current close (CC) to get D, the "distance":
D = CC--C
The indicator smooths the distance value twice (DS1 and DS2) with a 3-period EMA:
DS1 = EMA(3)(D)
DS2 = EMA(3)(DS1)
Now smooth the difference between HMAX and LMIN twice (DHL and DHL2), using the earlier EMA, and dividing the second result by 2:
DHL = EMA(3)(HMAX -- LMIN)
DHL2 = EMA(3)(DHL)/2
We can now calculate today's SMI value:
SMI = 100 * (DS2/DHL2)
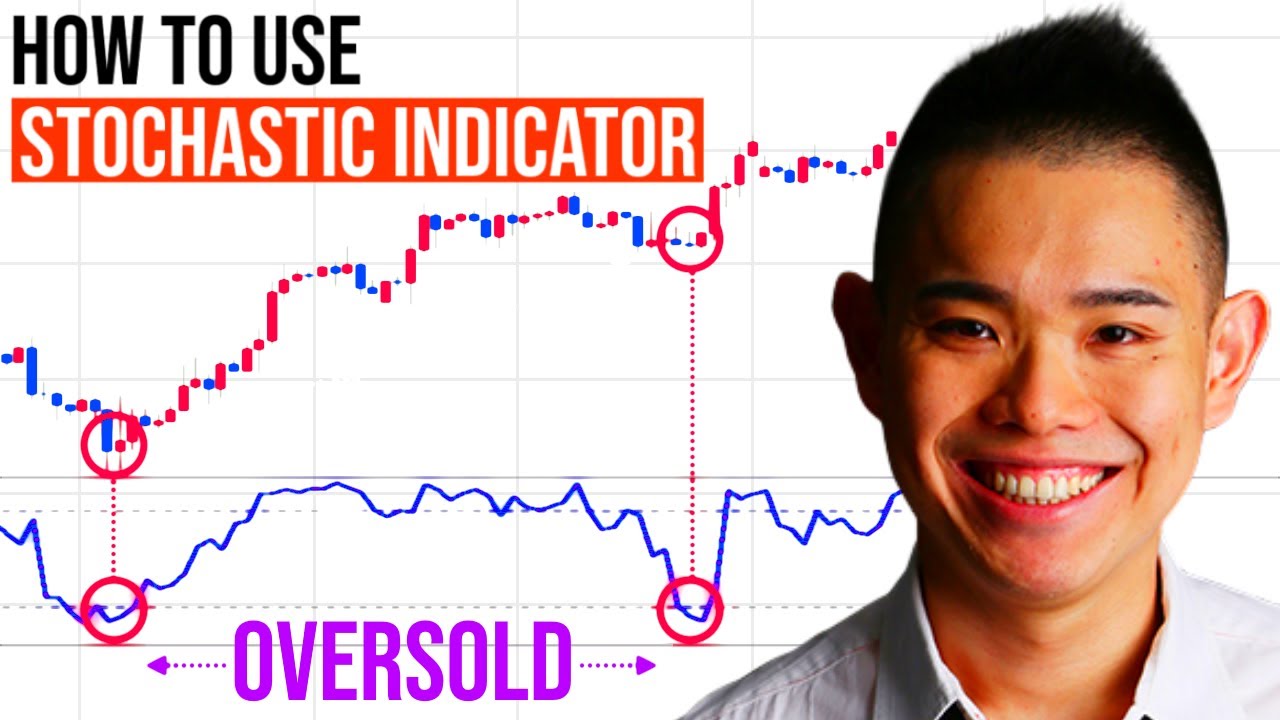
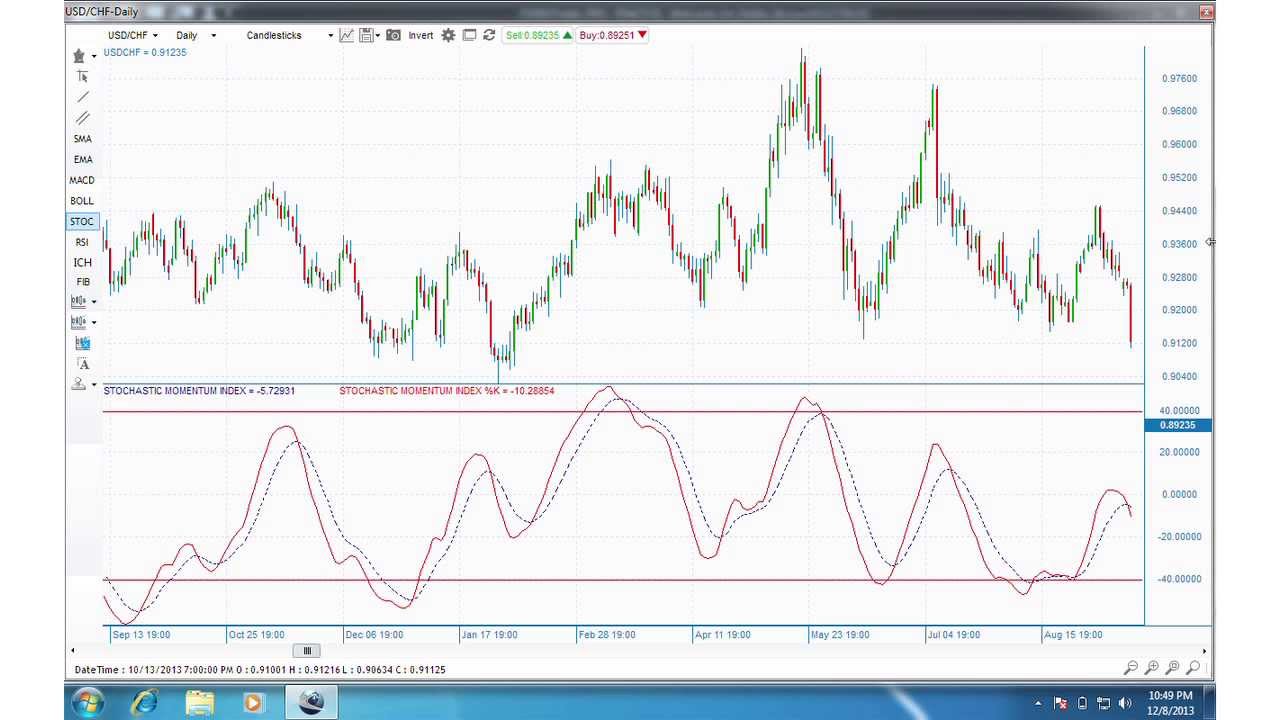
READING THE STOCHASTIC MOMENTUM INDEX
An extreme position (approaching -100 or +100) implies the likelihood of a reversal
Common trading level: Overbought (bullish) above +40 / Oversold (bearish) below -40
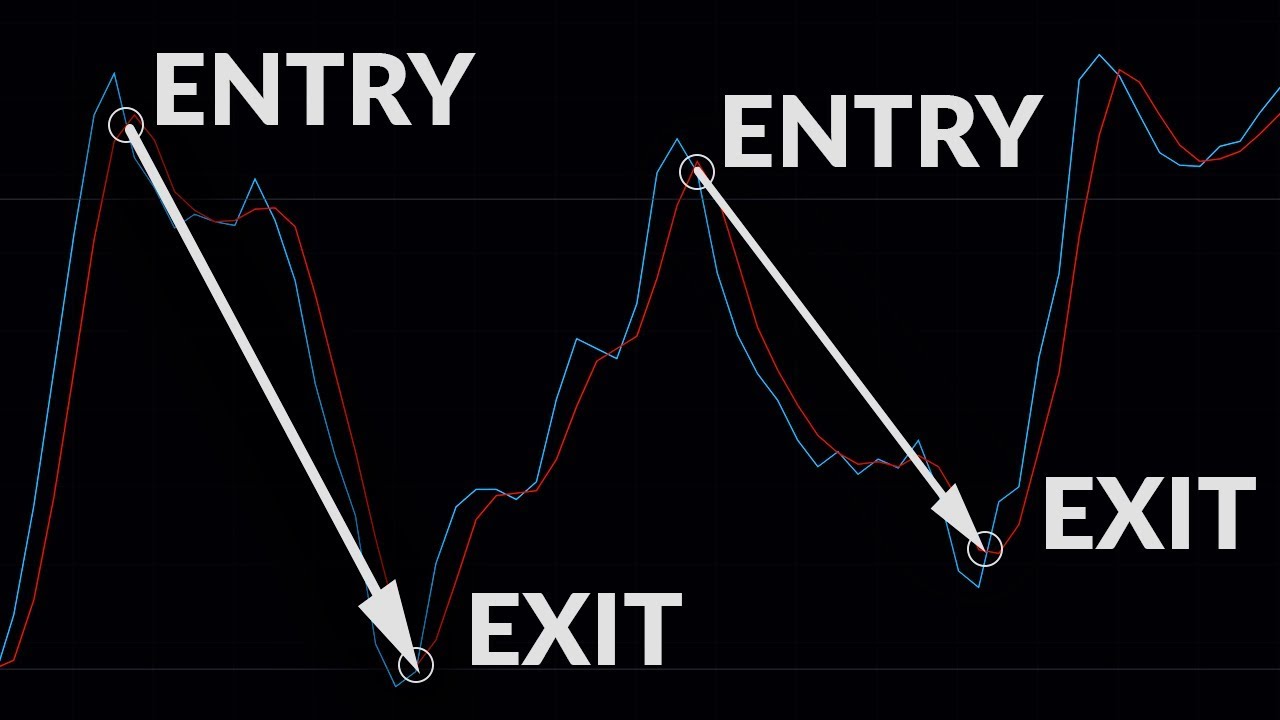
Basic turning point signals:
Buy when the indicator rises above -40 from below
Sell when the indicator moves below +40 from above
Cross-over 1: SMI passes moving average from below = Buy
Cross-over 2: SMI falls below moving average from above = Sell
(Cross-overs that occur between -15 and +15 are often unreliable)
Divergences are uncommon, but can be used to check signals or produce strong signals: Buy for bullish divergence, sell for bearish
Повторяем попытку...
Доступные форматы для скачивания:
Скачать видео
-
Информация по загрузке: