ycliper

Популярное

Музыка Кино и Анимация Автомобили Животные Спорт Путешествия Игры Юмор

Интересные видео

2025 Сериалы Трейлеры Новости Как сделать Видеоуроки Diy своими руками

Топ запросов

смотреть а4 schoolboy runaway турецкий сериал смотреть мультфильмы эдисон
Скачать

How Do You Tell If a Number is an Outlier? | Using IQR to find Outliers for a Modified Boxplot

Автор: Midnight Math Tutor

Загружено: 2023-03-14

Просмотров: 34303

Описание: Crayola Markers https://amzn.to/4lLkIlp (affiliate link)

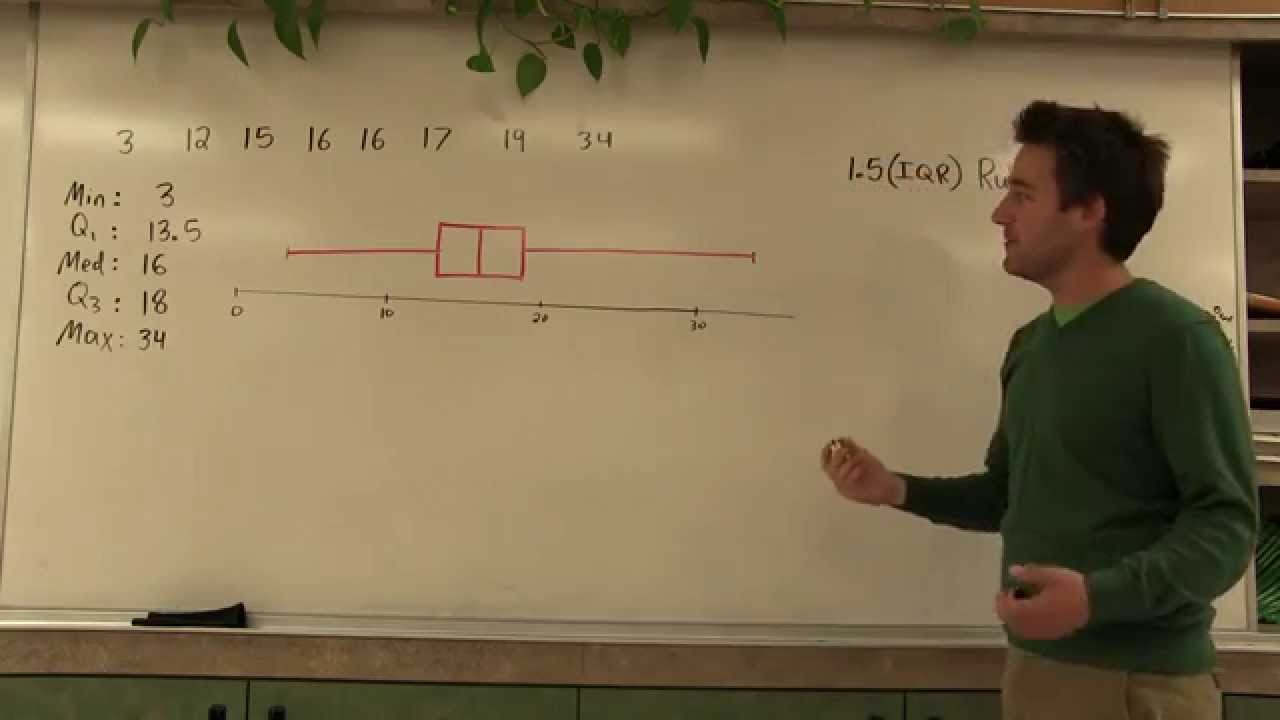
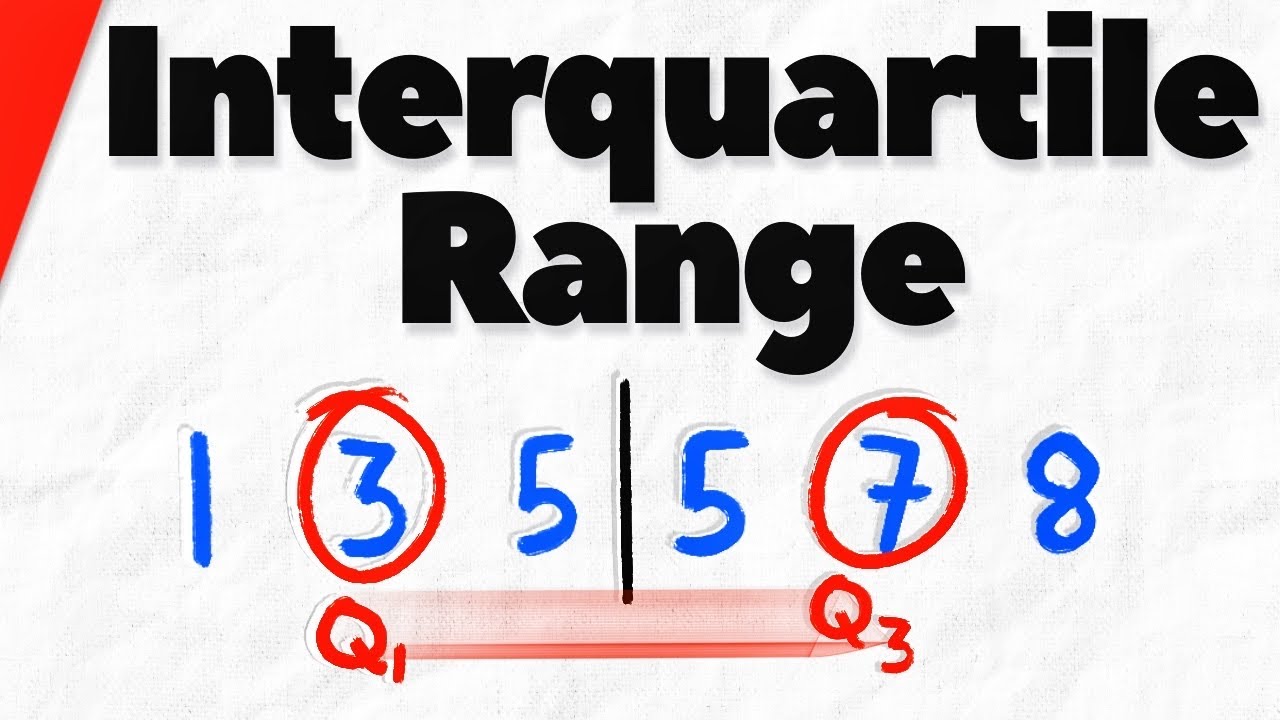
Outliers can skew & misrepresent your data. To take care of this, there is a process to follow to represent outliers in a different way on a boxplot. Watch the process to determine if a set of numbers has any outliers. The key to this is your IQR or Interquartile range.

#midnightmathtutor #boxplot #outliers

Enjoying our videos? Give us a like and subscribe!

Fonts used in thumbnail/logo: KG Always a Good Time, KG Drops of Jupiter

Не удается загрузить Youtube-плеер. Проверьте блокировку Youtube в вашей сети.
Повторяем попытку...
How Do You Tell If a Number is an Outlier? | Using IQR to find Outliers for a Modified Boxplot

Поделиться в:

Доступные форматы для скачивания:

Скачать видео

  • Информация по загрузке:

Скачать аудио

Похожие видео

How to Make a Modified Boxplot

How to Make a Modified Boxplot

Статистика - Как найти выбросы

Статистика - Как найти выбросы

Factoring Quadratic Equations Easily | Learn math

Factoring Quadratic Equations Easily | Learn math

Что такое выброс?

Что такое выброс?

How to Read a Stem-and-Leaf Plot (2-Digits) | Math with Mr. J

How to Read a Stem-and-Leaf Plot (2-Digits) | Math with Mr. J

How to calculate the upper and lower fences of a set of data

How to calculate the upper and lower fences of a set of data

Правило поиска выбросов и модифицированных диаграмм ящиков 1.5 (IQR)

Правило поиска выбросов и модифицированных диаграмм ящиков 1.5 (IQR)

How to Find the Interquartile Range of a Set of Data | Statistics

How to Find the Interquartile Range of a Set of Data | Statistics

Determining an Outlier Using the 1.5 IQR Rule

Determining an Outlier Using the 1.5 IQR Rule

Статистика — чтение формы распределения

Статистика — чтение формы распределения

Box & Whisker Plots | Modified Boxplots | Mean, Median, Mode, Range

Box & Whisker Plots | Modified Boxplots | Mean, Median, Mode, Range

How To Find The Interquartile Range & any Outliers - Descriptive Statistics

How To Find The Interquartile Range & any Outliers - Descriptive Statistics

How to Make a Boxplot with Outliers

How to Make a Boxplot with Outliers

Как построить диаграмму «ящик с усами» из набора чисел | 5 вещей, необходимых для построения диаг...

Как построить диаграмму «ящик с усами» из набора чисел | 5 вещей, необходимых для построения диаг...

Examples analyzing clusters, gaps, peaks and outliers for distributions | 6h grade | Khan Academy

Examples analyzing clusters, gaps, peaks and outliers for distributions | 6h grade | Khan Academy

Finding Outliers using Interquartile Range | Statistics, IQR, Quartiles

Finding Outliers using Interquartile Range | Statistics, IQR, Quartiles

How to Find the Range | Math with Mr. J

How to Find the Range | Math with Mr. J

Interquartile Range (IQR) | Math with Mr. J

Interquartile Range (IQR) | Math with Mr. J

Как построить диаграммы типа «ящик с усами»

Как построить диаграммы типа «ящик с усами»

Comparing dot plots, histograms, and box plots | Data and statistics | 6th grade | Khan Academy

Comparing dot plots, histograms, and box plots | Data and statistics | 6th grade | Khan Academy

© 2025 ycliper. Все права защищены.


  • Контакты
  • О нас
  • Политика конфиденциальности


Контакты для правообладателей: [email protected]