ftop GitHub Explained: Apple Silicon Monitoring Without Legacy Refresh Stutter
Автор: Alex Hitt
Загружено: 2026-10-19
Просмотров: 728
Описание:
ftop by nongfsq: https://github.com/nongfsq/ftop
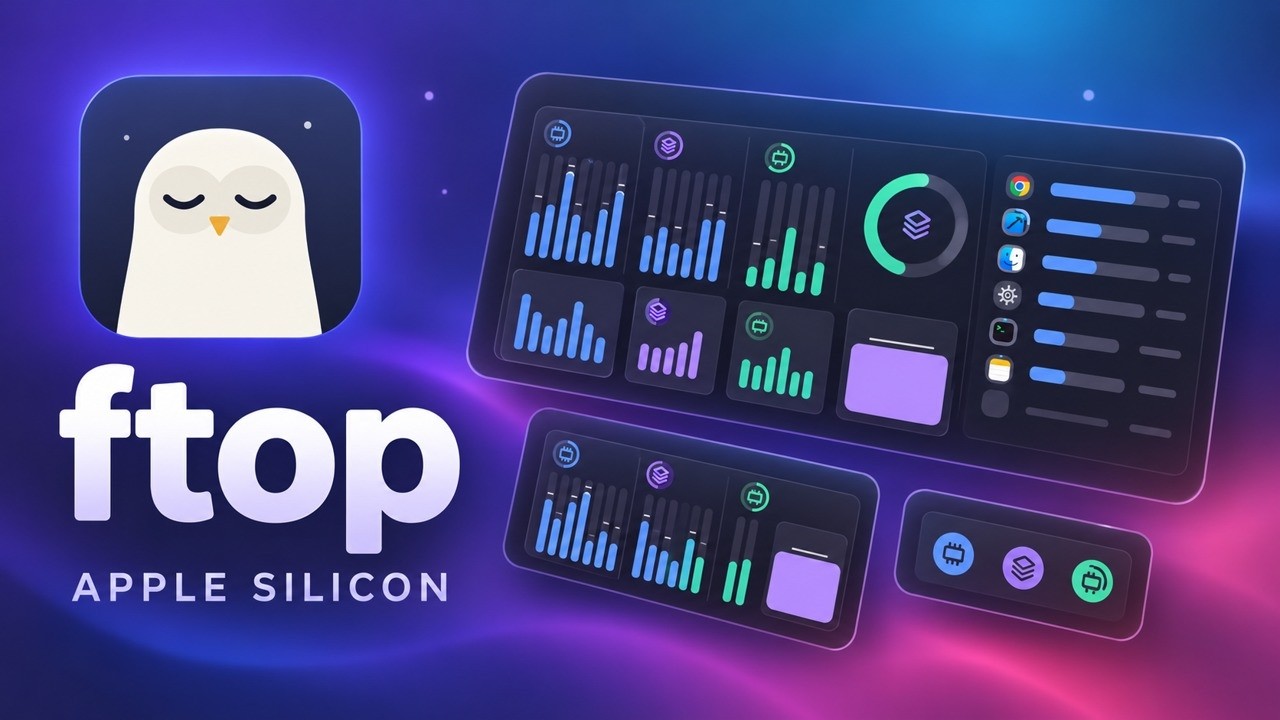
ftop is a native Swift/AppKit system monitor for Apple Silicon Macs. Its floating glass panel maps performance and efficiency CPU clusters, GPU load and frequency, unified-memory states, process share, power and thermal readings into a compact current-state view. The overview also explains why its 100%-capped machine-share model avoids the multi-core totals shown by Activity Monitor, and how continuous easing plus occlusion-aware polling keeps the panel fluid without turning it into a history dashboard. The trade-off is deliberate: ftop leaves out historical graphs and disk I/O, relies on private IOReport/HID interfaces, and needs a restricted helper for broader process visibility.
TimeStamps:
0:00 Apple Silicon monitoring problem
0:31 Why Activity Monitor can exceed 100%
1:05 ftop's native glass-panel approach
1:41 CPU and GPU telemetry columns
2:34 Unified memory states
3:03 100% machine-share process view
3:30 Continuous easing vs. terminal redraws
4:02 Occlusion-aware resource use
4:23 Privileged helper for system processes
5:04 Private IOReport and App Store limits
5:28 Deliberate omissions and current-state focus
5:50 What ftop trades for a quiet live view
🧠 Apple Silicon core and memory telemetry
📊 100%-capped process-share view
🪟 Continuous easing and occlusion-aware rendering
🔒 Private APIs, helper permissions, and trade-offs
ftop fits developers who want a quiet, live view of Apple Silicon behavior rather than a historical profiler. Its strengths are silicon-specific gauges, fluid AppKit rendering, and a compact process hierarchy; its boundaries are equally important: Apple Silicon only, no historical or disk-I/O charts, and private API plus helper-permission dependencies.
#ftop #AppleSilicon #MacMonitoring
Повторяем попытку...
Доступные форматы для скачивания:
Скачать видео
-
Информация по загрузке: