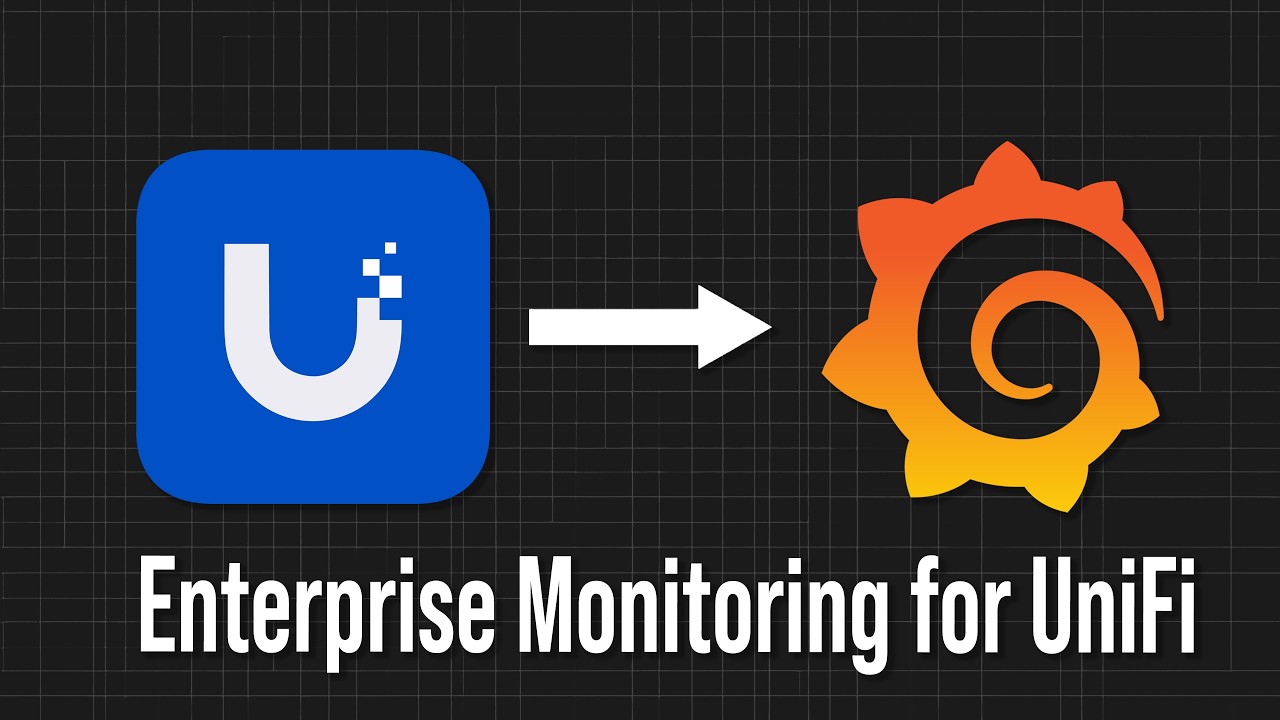
Build Enterprise-Grade UniFi Monitoring with Unpoller, Prometheus & Grafana
Автор: Techno Tim
Загружено: 2025-12-21
Просмотров: 43387
Описание:
Build a UniFi observability stack with Unpoller, Prometheus, and Grafana to collect and visualize real network metrics over time.
Get the code: https://github.com/timothystewart6/un...
Video notes: https://technotim.live/posts/unpoller...
Unpoller: https://github.com/unpoller/unpoller
Find a UniFi Gateway: https://store.ui.com/us/en/category/a... (affiliate link)
Merch Shop 🛍️: https://l.technotim.live/shop
Support me on Patreon: / technotim
Sponsor me on GitHub: https://github.com/sponsors/timothyst...
Subscribe on Twitch: / technotim
Become a YouTube member: / @technotim
Gear Recommendations: https://l.technotim.live/gear
Get Help in Our Discord Community: https://l.technotim.live/discord
2nd channel: / @technotimtinkers
(Affiliate links may be included in this description. I may receive a small commission at no cost to you.)
00:00 - Why Observability for UniFi?
01:00 - Architecture Overview (Unpoller, Prometheus, Grafana)
01:49 - Docker Compose Stack Overview
02:07 - Prometheus Configuration
02:27 - Grafana Configuration & Provisioning
02:46 - Unpoller Configuration
03:03 - Optional: Dozzle for Logs
03:14 - Permissions & Volumes (Quick Notes)
03:28 - Unpoller Env File
03:44 - UniFi User Account for Unpoller
04:31 - Prometheus Scrape Job
04:54 - Starting the Stack
05:05 - Sanity Check in Prometheus
05:17 - Grafana First Launch
05:30 - Access Point Dashboards (Core Value)
06:08 - UniFi Switch Dashboard
06:51 - UniFi Client Dashboard
08:17 - Final Thoughts & Next Steps
Thank you for watching!
Повторяем попытку...
Доступные форматы для скачивания:
Скачать видео
-
Информация по загрузке: