Normal Distribution - 68, 95, 99.7 Rule - Introductory Statistics (Part 1)
Автор: Quantitative Specialists
Загружено: 2014-08-11
Просмотров: 33788
Описание:
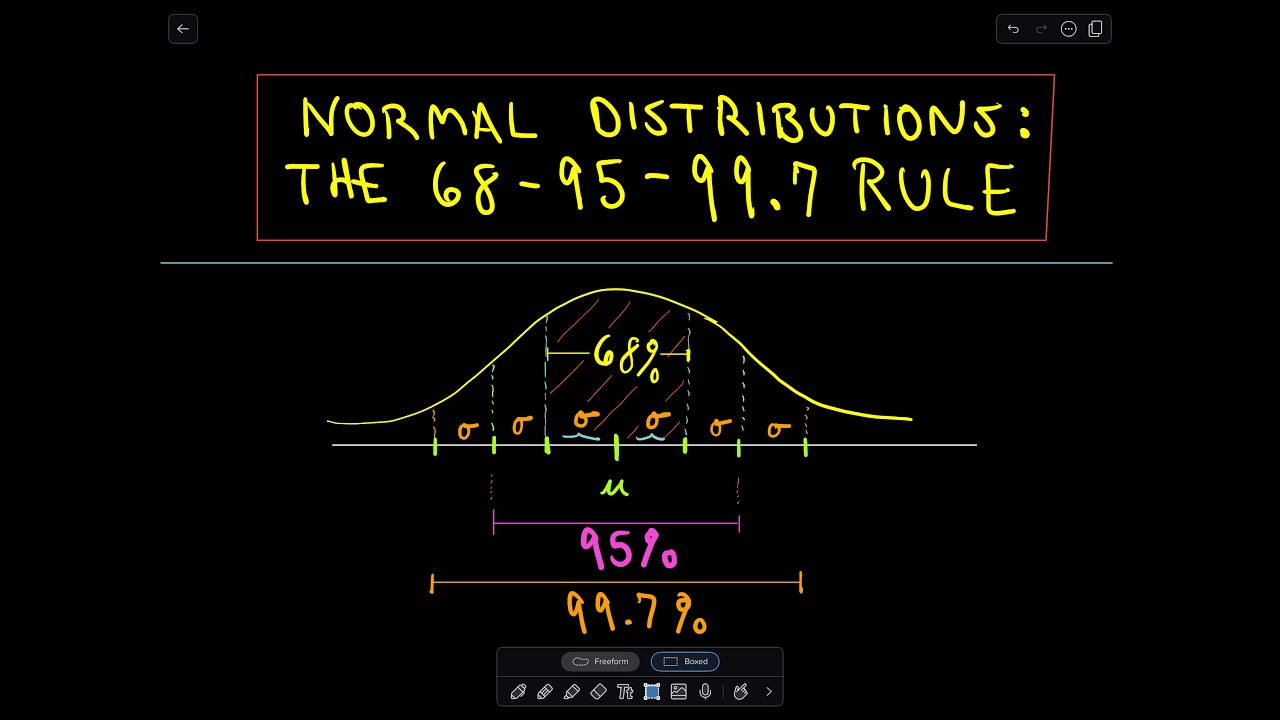
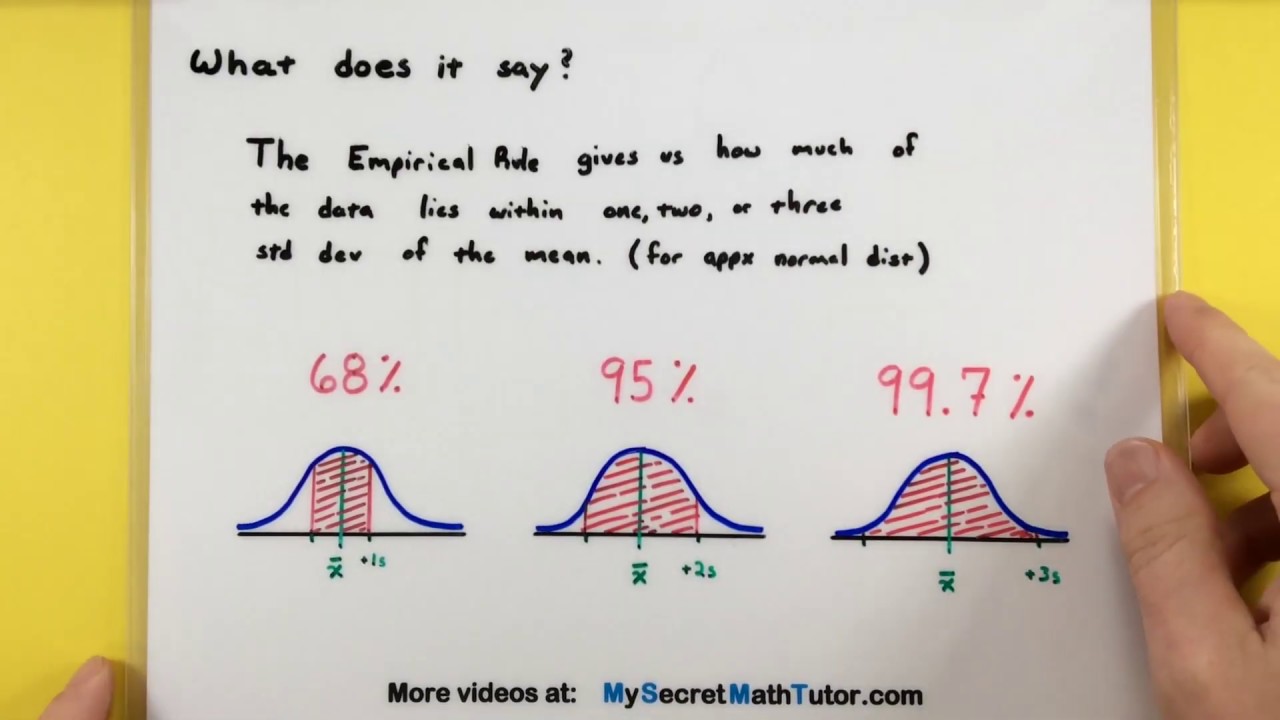
This video covers z scores and the normal probability distribution, including how the 68, 95, 99.7 rule is obtained in statistics.
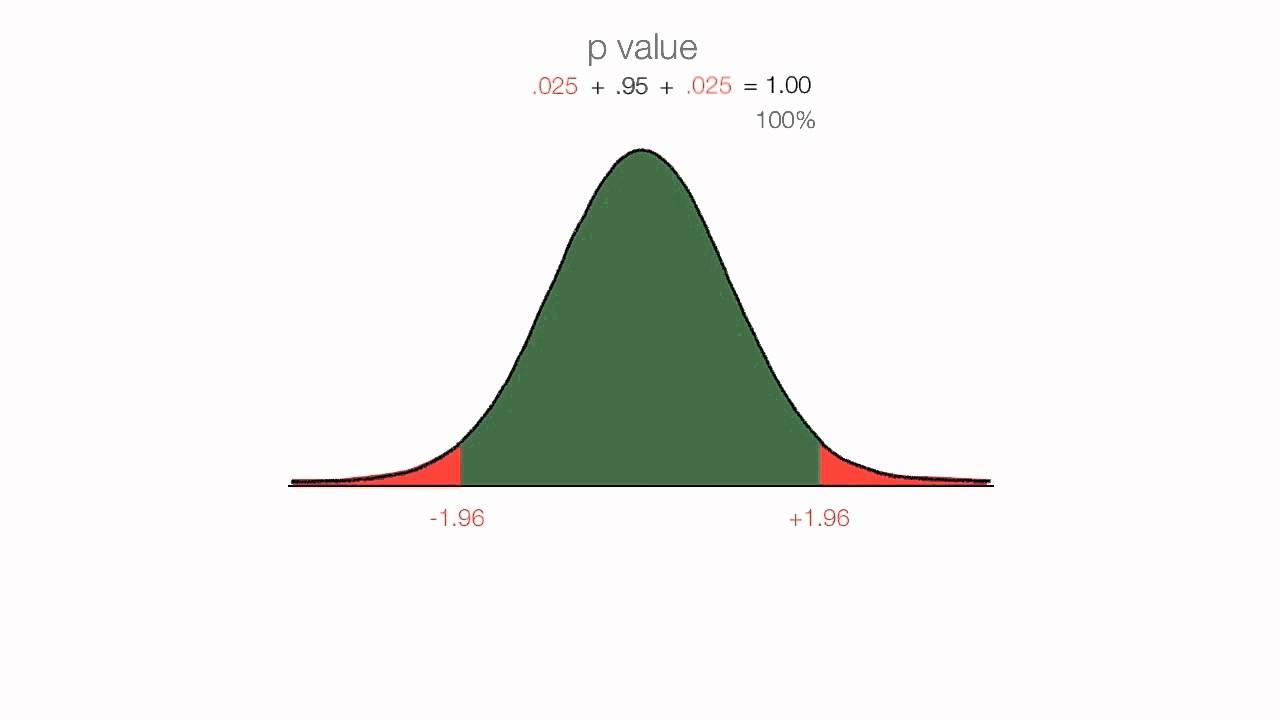
Video Transcript: In this video we'll take a look at z scores and the normal distribution. On your screen you can see towards the bottom it says z-value and you can think of this as z-value or a z-score. And notice that it's labeled with a zero at the center there, so that's a z value of zero, and in a normal distribution the center is always zero when it's in z-score form, and it's also equal to the mean as well as the median and the mode. So the mean, median, and mode are all equal to each other and they happen to be a z of 0 in a normal distribution. Next, notice that to the right the values increase, where we have z of 1 and then of 2 and then 3. And then to the left we have a z of negative 1 negative 2 and negative 3. Now it's helpful to know that in a z-score distribution, each z score indicates the number of standard deviation units a value is from the mean. So, for example, this z of 1 here, if there was a value right here at a z of 1, it means that that value is 1 standard deviation above the mean. For a z of 2, it's two standard deviations above the mean. And, for a z of -2, for example, that's two standard deviations below the mean, since its negative. So anytime you hear a z-score, like a z-score of -2, that indicates the number of standard deviations a value is from the mean, and since it’s negative, once again, it's below. Now we can look at this curve and isolate various areas and find the proportions or percentage of values under the curve in those areas. So let's go ahead and take a look at that. So from a mean of 0 to 1, the proportion or area under the curve there is .3413. And you may recall that a normal distribution is a symmetrical distribution, so in other words, if we slice the distribution exactly in half, one side is a mirror image of the other. So if from 0 to 1 our proportion is .3413, then it should make sense that from 0 -1 the proportion is also .3413. And that's always the case, because the distribution is symmetrical. Now often what you'll see is people will add together these two values to express the proportion of obtaining a value between -1 and +1. And if we do that we can see that it's equal to .6826, in other words, 68.26% of the values in this entire distribution fall within a z of -1 to +1, so 68% of the values are in this area here. Now next we can look from a z from 1 to 2 and see what proportion of values fall in this area. And it is in fact .1359 or 13.59% of the values fall between a z of 1 and a z of 2, or put another way, from 1 to 2 standard deviations above the mean. And recall that the normal distribution, once again, is symmetrical. So if this area from 1 to 2 is 13.59%, then you should be able to figure out that this would be the exact same, or 13.59% as well. Now just like we added these two values here together
YouTube Channel (Quantitative Specialists): / statisticsinstructor
For step by step help with statistics, with a focus on SPSS. Both descriptive and inferential statistics covered. For descriptive statistics, topics covered include: mean, median, and mode in spss, standard deviation and variance in spss, bar charts in spss, histograms in spss, bivariate scatterplots in spss, stem and leaf plots in spss, frequency distribution tables in spss, creating labels in spss, sorting variables in spss, inserting variables in spss, inserting rows in spss, and modifying default options in spss. For inferential statistics, topics covered include: t tests in spss, anova in spss, correlation in spss, regression in spss, chi square in spss, and MANOVA in spss. New videos regularly posted. Videos series coming soon include: multiple regression in spss, factor analysis in spss, nonparametric tests in spss, multiple comparisons in spss, linear contrasts in spss, and many more. Subscribe today!
YouTube channel: / statisticsinstructor
Inferential course: https://www.udemy.com/inferential-sta...
Descriptives course: https://www.udemy.com/descriptive-sta...
ANOVA course: https://www.udemy.com/anova-spss
MANOVA course: https://www.udemy.com/manova-spss
Introductory statistics
z scores
normal distribution
areas under the curve
proportion in curve - z scores
Повторяем попытку...

Доступные форматы для скачивания:
Скачать видео
-
Информация по загрузке: