Build Your First Power BI Report in One Hour (free masterclass + sample files 📂)
Автор: Chandoo
Загружено: 2026-02-13
Просмотров: 11992
Описание:
Build a real Power BI dashboard step-by-step — from raw data to insights. Learn how to build a complete Power BI dashboard from scratch using a realistic hospital analytics dataset.
In this live masterclass, we go step-by-step from understanding raw data to creating meaningful business insights using data modeling, DAX measures, and interactive visuals in Power BI.
You’ll learn how experienced analysts actually work — including how to design analysis goals, build measures, understand evaluation context, and create professional dashboards.
✅ What you’ll learn
How to design a Power BI report from a business problem
Data modeling using Doctors, Patients & Calendar tables
Writing practical DAX measures
Evaluation Context explained simply
Creating interactive visuals and KPI cards
Real-world Power BI workflow used by analysts
📊 Topics Covered
00:00 What You’ll Learn in This Power BI Masterclass
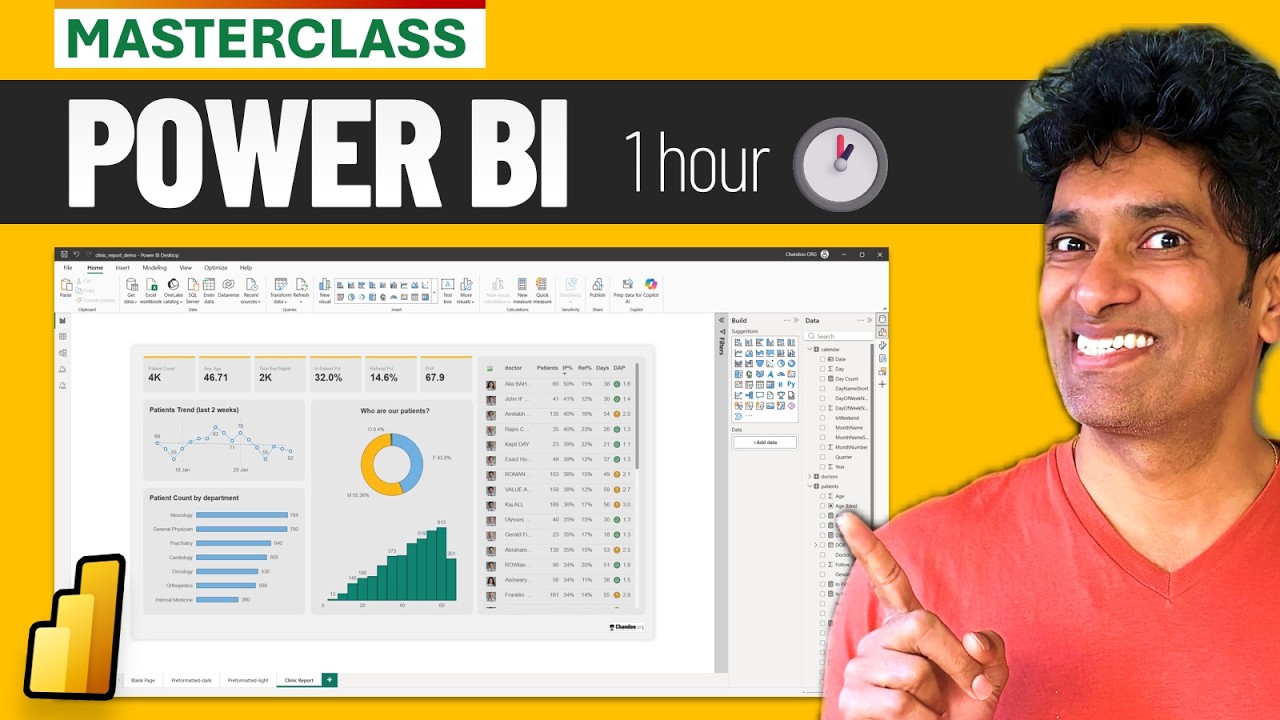
01:10 The Report We’re Building (Final Dashboard Preview)
07:25 Exploring the Practice File & Report Setup
09:40 Understanding the Clinic / Hospital Dataset
14:37 Hospital Data Model Explained (Doctors, Patients & Calendar)
20:29 Defining Our Analysis Goals in Power BI
27:30 Setting Up Report Pages for Analysis
29:23 Creating Our First Measure — Patient Count
32:55 First Power BI Visual — Patients by Department
34:51 Evaluation Context Explained (Simple Real Example)
39:45 Visual Interactions in Power BI (Adding Another Chart)
42:00 Required Data Cleaning & Transformations (Power Query)
50:44 Quick Recap — What We’ve Built So Far
52:00 Building Core Measures — Bed Nights, Avg Age, DAP & IP %
01:04:30 My Typical Power BI Workflow (End-to-End Approach)
01:07:00 Formatting KPI Cards Like a Pro
01:12:00 Patient Trend Analysis (Line Chart)
01:16:44 Department Breakdown Analysis
01:18:10 Gender Distribution Analysis
01:18:30 Patient Age Grouping Explained
01:20:20 Doctor-Level Analysis (Table Visual)
01:26:40 Final Dashboard Walkthrough & Key Takeaways
01:28:00 Live Q&A
💡 Who this is for
Intermediate Power BI learners
Data analysts wanting real-world workflow examples
Excel users moving into Power BI
Anyone learning DAX and dashboard design
🧠 Dataset & Practice Files
Sample file link:
https://github.com/chandoo-org/Power-...
Completed file:
https://github.com/chandoo-org/Power-...
📺 Other Power BI Videos:
Power BI in 10 mins: • Your first 10 minutes of Power BI - A no-n...
Power BI Intro in 30 mins: • Power BI is EASY: Get started and make you...
How to use Power BI Visuals: • Power BI Visuals Masterclass – Make Charts...
Beginner to PRO Power BI Class: • Beginner to PRO Data Analysis with Power B...
Advanced Power BI Class: • FREE Adv. Masterclass on Power BI - Create...
Power BI Finance Dashboard: • Make an Incredible Finance KPI Dashboard w...
HR Dashboard with Power BI: • HR Data Analytics & Awesome Dashboard with...
80% DAX in 1 hour: • Learn 80% of DAX in an Hour (with FREE sam...
Power Query in 15 mins: • How to use Power Query in Excel - Perfect ...
Power Query in 30 mins: • Power Query - Beginner to PRO Masterclass ...
🎁 My Comprehensive DAX + Power Query + Power BI Course:
If you want a one-stop course to learn Power BI (and DAX, Power Query and Dashboards) take a look at this page. use code SAVE50 to get $50 discount.
https://chandoo.org/wp/power-bi-course/
~
#PowerBI #Live
Повторяем попытку...
Доступные форматы для скачивания:
Скачать видео
-
Информация по загрузке: