Скачать
Create an interactive periodic table component from scratch using Angular 5 and html canvas graphics
Автор: Heeler Media
Загружено: 2018-05-09
Просмотров: 4357
Описание:
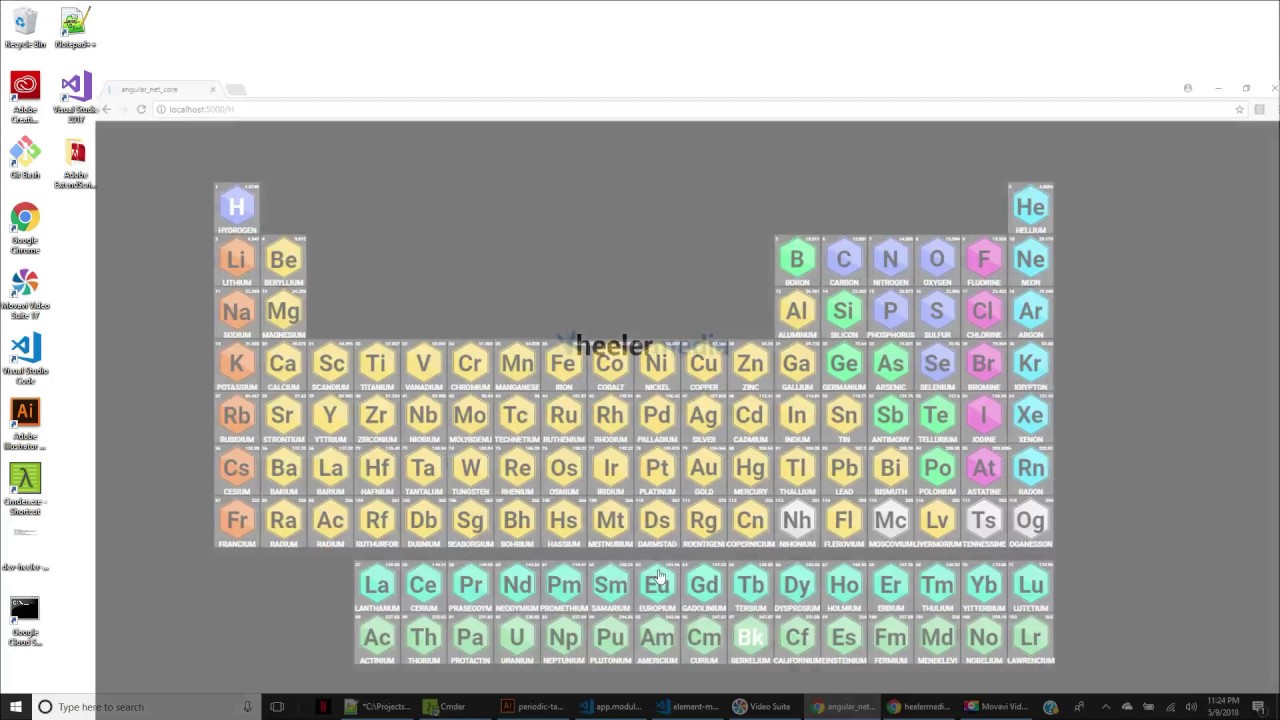
Create a data driven, interactive, periodic table using angular components, the html 5 canvas graphics api and vector meta data from adobe illustrator.
Learn how to use a logical display model to interface with an html canvas.
Link to code on github:
https://github.com/heelermedia/angula...
Не удается загрузить Youtube-плеер. Проверьте блокировку Youtube в вашей сети.
Повторяем попытку...
Повторяем попытку...
Доступные форматы для скачивания:
Скачать видео
-
Информация по загрузке: