Energy Level Consumption By Country Per Capita | 1965 - 2025 | Epic Bar Chart Race
Автор: Lyrical Stats
Загружено: 2025-12-18
Просмотров: 209
Описание:
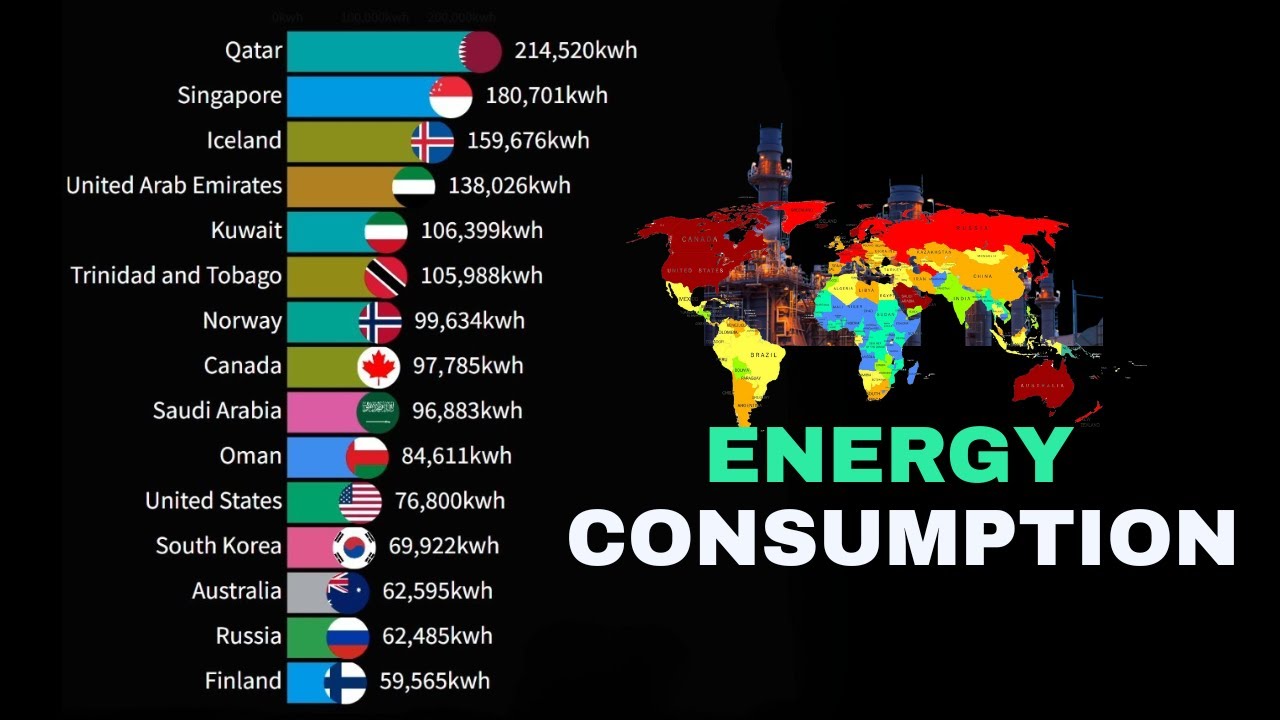
Energy Level Consumption By Country Per Capita from 1965 to 2025. Watch how economies expand, peak, and shift over six decades as countries rise and fall in per‑capita energy consumption. This visually compelling comparison highlights development, policy impacts, and energy transitions across the world.
What you’ll see
A dynamic year-by-year visualization of per‑capita energy consumption by country
Shifts in leadership from industrialized nations to emerging economies
Insights into global energy patterns, efficiency gains, and consumption growth
Data source: Our World in Data. All data is used with appropriate attribution and is intended for educational visualization purposes.
Data methodology (brief)
Per‑capita energy consumption values compiled from reputable sources and harmonized for cross-country comparability
Year range: 1965–2025
Visualization emphasizes relative growth, rankings, and long-term trends
Why this video matters
Understand how energy demand correlates with economic development
See the impact of policy, technology, and market changes on energy use
Explore historical context behind today’s energy landscape
How to use this video
Pause and zoom to compare specific country trajectories
Use the timeline to study long-term patterns and turning points
Compare high-energy vs. lower-energy regions and track convergences/divergences
If you found this visualization insightful, please like, share, and subscribe for more data-driven visual storytelling. Leave a comment with which country surprised you the most.
Повторяем попытку...
Доступные форматы для скачивания:
Скачать видео
-
Информация по загрузке:


