Скачать
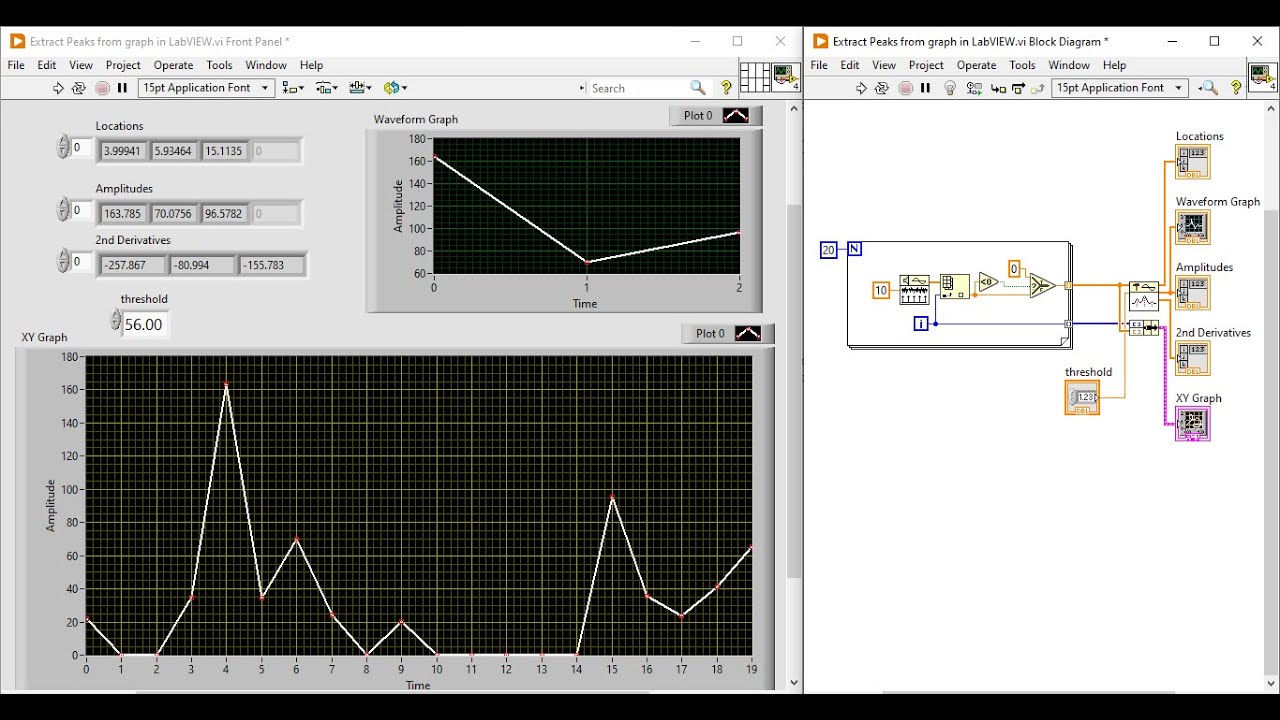
Detect/count peaks from Signals and plot on graph in LabVIEW
Автор: LabVIEW Exercises
Загружено: 2021-08-21
Просмотров: 12819
Описание:
#PeakDetection #SignalsProcessing #LabVIEW
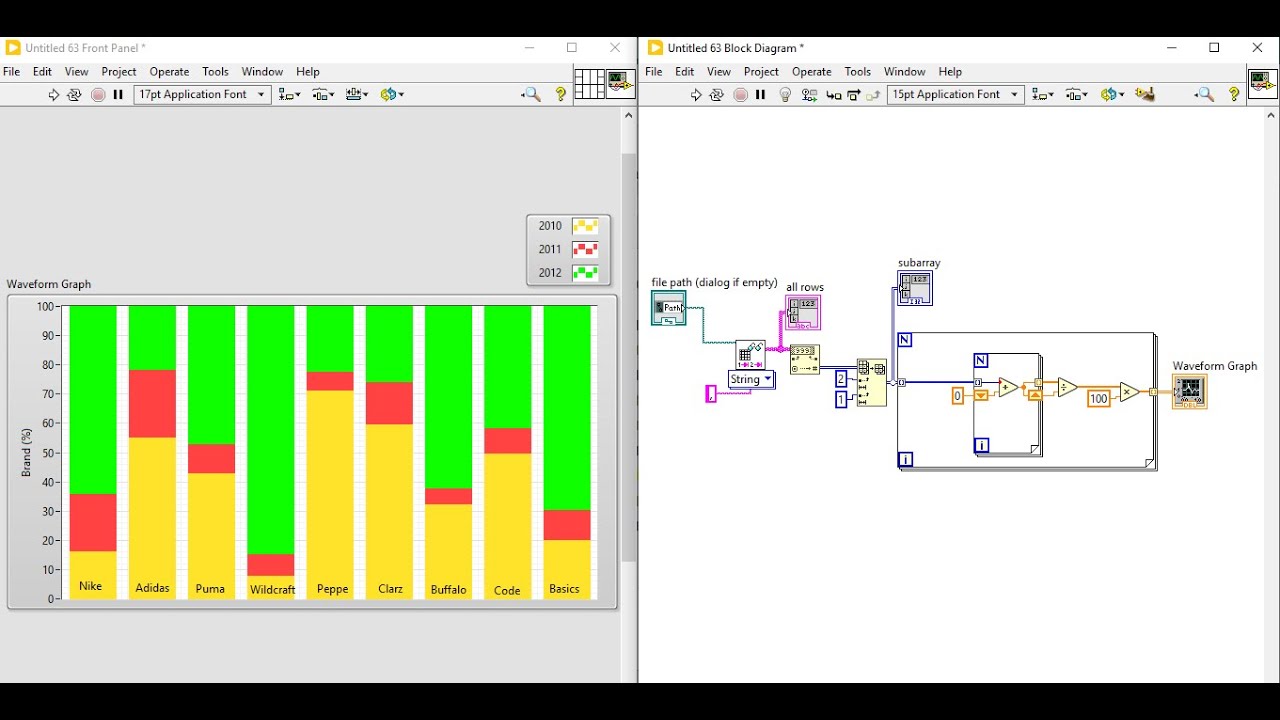
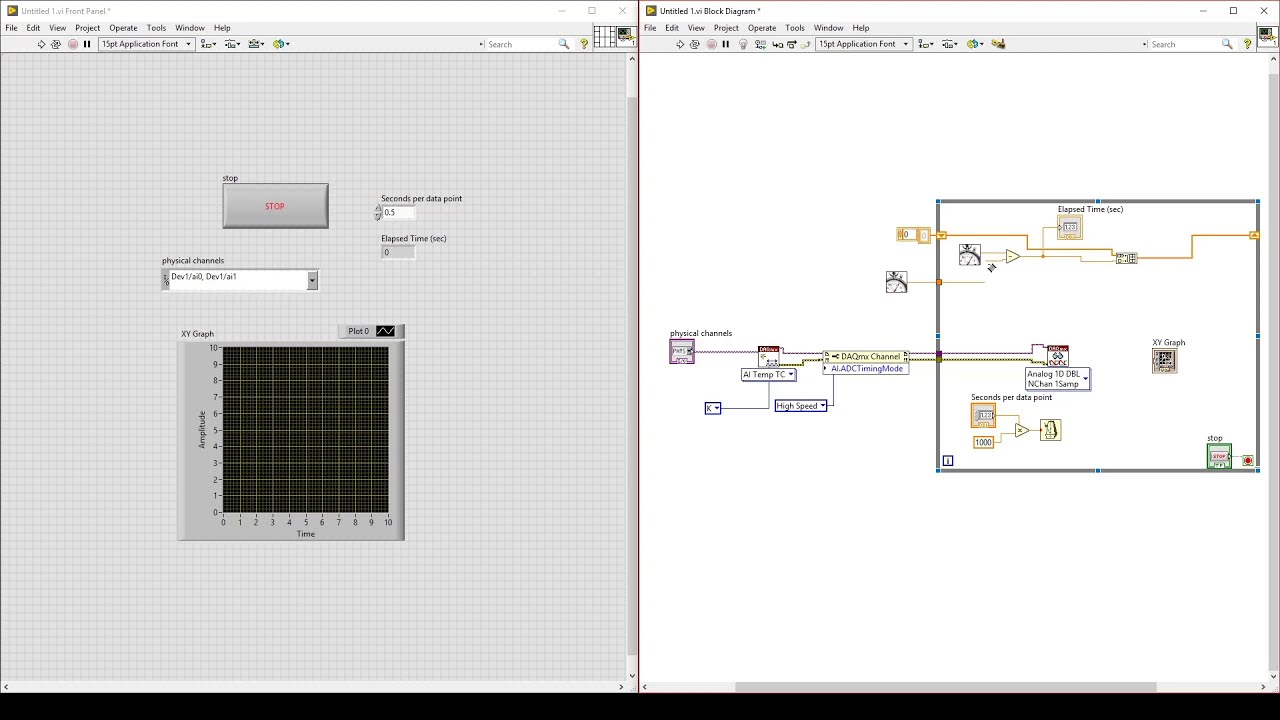
Data plotted on waveform or XY graphs in LabVIEW can be filtered like detecting required peaks which will be useful to fetch required outcomes like peak area, retention time and double derivative etc.
Contact us for your LabVIEW projects: [email protected]
Join us on Facebook page: / 147407820769630
Не удается загрузить Youtube-плеер. Проверьте блокировку Youtube в вашей сети.
Повторяем попытку...
Повторяем попытку...
Доступные форматы для скачивания:
Скачать видео
-
Информация по загрузке: