ycliper

Популярное

Музыка Кино и Анимация Автомобили Животные Спорт Путешествия Игры Юмор

Интересные видео

2025 Сериалы Трейлеры Новости Как сделать Видеоуроки Diy своими руками

Топ запросов

смотреть а4 schoolboy runaway турецкий сериал смотреть мультфильмы эдисон
Скачать

Maarten Breddels | A billion stars in the Jupyter Notebook

Автор: PyData

Загружено: 2017-04-25

Просмотров: 6747

Описание: PyData Amsterdam 2017

Github: https://github.com/maartenbreddels/ip...

I will present two Python packages: Vaex enables calculating statistics for a billion samples per second on a regular N-dimensional grid. Using a new Python package, ipyvolume, that enabled volume rendering and glyph rendering, this allows one to interactively visualise and explore these billion sample tables for high dimensional spaces.

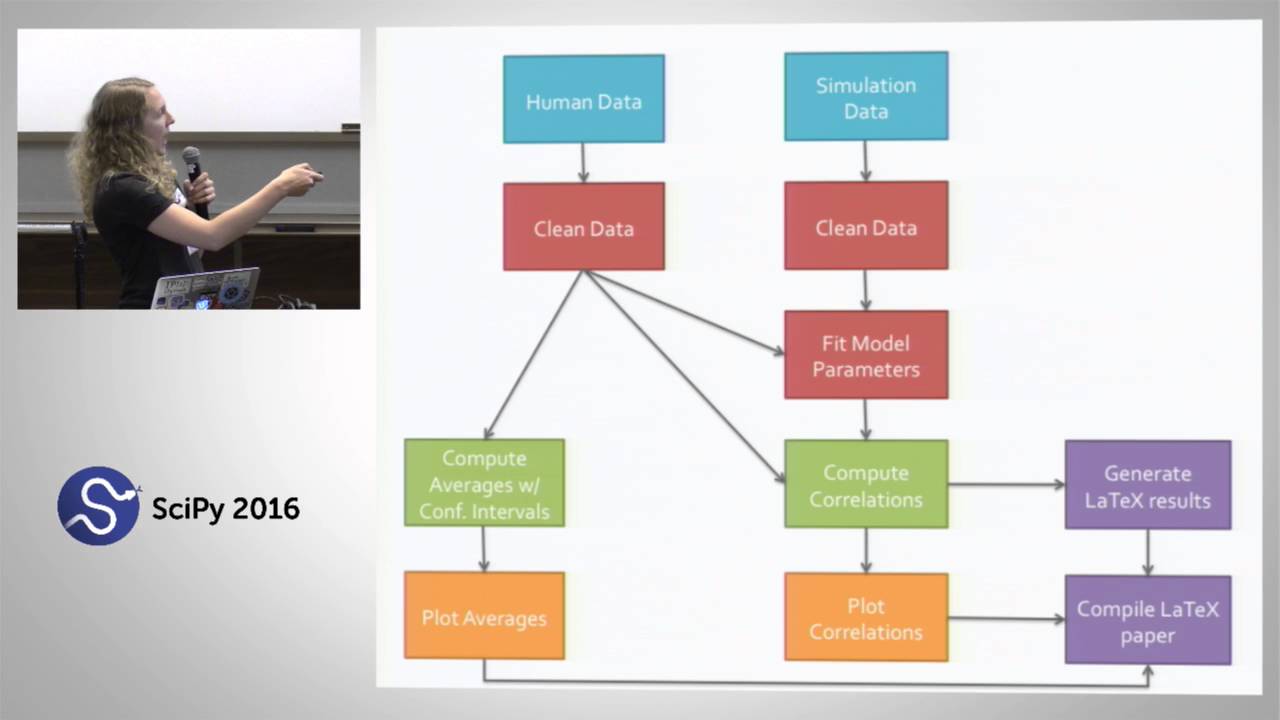
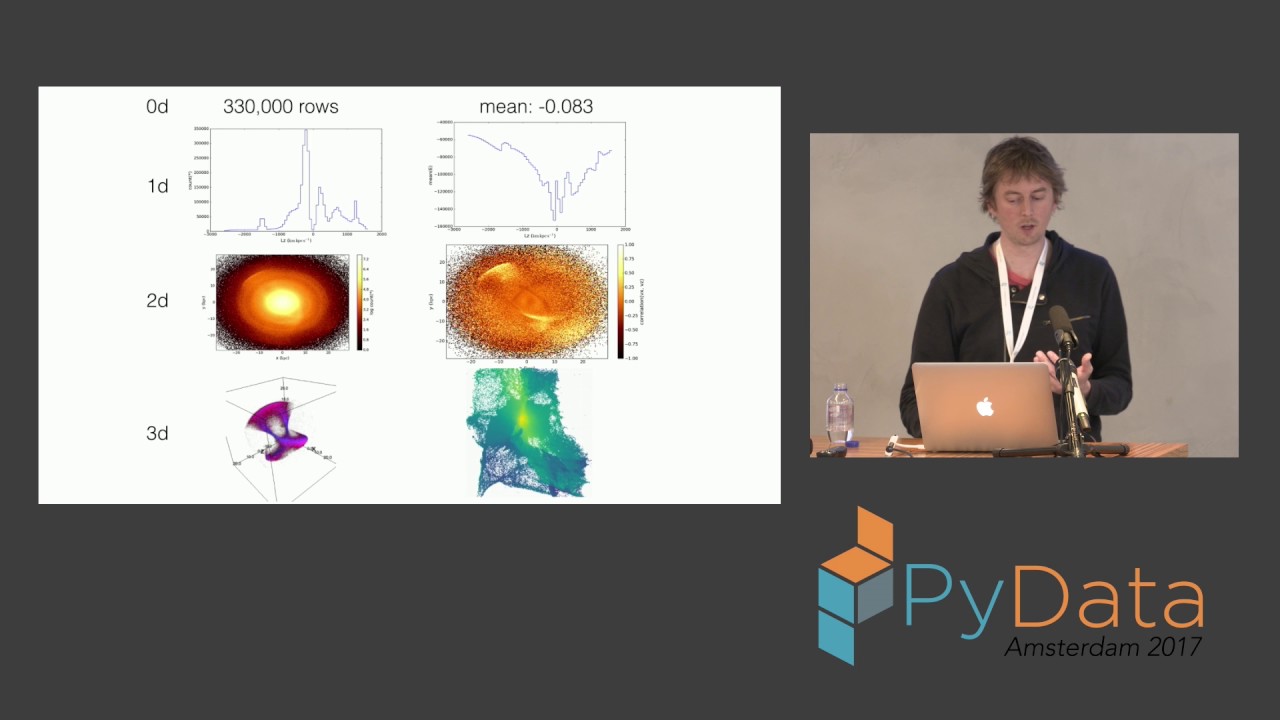
With large astronomical catalogues (>1 billion) already available, we are preparing for methods to visualize and explore these large datasets. Instead of using cluttered scatter plots, these data volumes require different visualization techniques, in the form of binned statistics, e.g. histograms, density maps, and volume rendering in 3d. The calculation of statistics on N-dimensional grids is handled by Python library called vaex, which I will introduce. It can process at least a billion stars/samples per second, to produce for instance the mean of a quantity on a regular grid. This statistics can be calculated for any mathematical expression on the data (numpy style) and can be on the full dataset or subsets, specified by queries/selections, .

However, to visualize higher dimensional data in the notebook interactively, no proper solution existed. This led to the development of ipyvolume, which can render 3d volumes and up to a million glyphs (scatter plots and quiver) in the (Jupyter) notebook as a widget. With the browser as a platform, and the release of ipywidgets 6.0, these 3d plots can also be embedded in static html files and renders on nbviewer. This allows for sharing with colleagues, paperless office (render on your tablet), outreach, press release material, etc. Full screen stereo rendering allows for a virtual reality experience using your phone and Google Cardboard, a minor investment compared to other VR head mountables. Overlaying 3d quiver plots on a 3d volume rendering allows visualizing a 6d space.

Vaex and ipyvolume can be used together to explore and visualize any large tabular data set, or separately to calculate statistics, and render 3d plots in the notebook and outside. 00:00 Welcome!
00:10 Help us add time stamps or captions to this video! See the description for details.

Want to help add timestamps to our YouTube videos to help with discoverability? Find out more here: https://github.com/numfocus/YouTubeVi...

Не удается загрузить Youtube-плеер. Проверьте блокировку Youtube в вашей сети.
Повторяем попытку...
Maarten Breddels | A billion stars in the Jupyter Notebook

Поделиться в:

Доступные форматы для скачивания:

Скачать видео

  • Информация по загрузке:

Скачать аудио

Похожие видео

PyData Ann Arbor: Carol Willing | TBD: Taming Big Data with Jupyter and Friends

PyData Ann Arbor: Carol Willing | TBD: Taming Big Data with Jupyter and Friends

Stephen Elston - Data Visualization and Exploration with Python

Stephen Elston - Data Visualization and Exploration with Python

Tristan Boudreault | Survival analysis for conversion rates

Tristan Boudreault | Survival analysis for conversion rates

Randall J. LeVeque - Writing a Book in Jupyter Notebooks

Randall J. LeVeque - Writing a Book in Jupyter Notebooks

Алгоритмы на Python 3. Лекция №1

Алгоритмы на Python 3. Лекция №1

Brian Granger, Chris Colbert & Ian Rose - JupyterLab+Real Time Collaboration

Brian Granger, Chris Colbert & Ian Rose - JupyterLab+Real Time Collaboration

Лучший документальный фильм про создание ИИ

Лучший документальный фильм про создание ИИ

Brian Granger: All About Jupyter

Brian Granger: All About Jupyter

Make Jupyter/IPython Notebook even more magical with cell magic extensions!

Make Jupyter/IPython Notebook even more magical with cell magic extensions!

Но что такое нейронная сеть? | Глава 1. Глубокое обучение

Но что такое нейронная сеть? | Глава 1. Глубокое обучение

4 Hours Chopin for Studying, Concentration & Relaxation

4 Hours Chopin for Studying, Concentration & Relaxation

Музыка для работы за компьютером | Фоновая музыка для концентрации и продуктивности

Музыка для работы за компьютером | Фоновая музыка для концентрации и продуктивности

КАК УСТРОЕН TCP/IP?

КАК УСТРОЕН TCP/IP?

Jake VanderPlas   The Python Visualization Landscape   PyCon 2017

Jake VanderPlas The Python Visualization Landscape PyCon 2017

Giovanni Lanzani | Applied Data Science

Giovanni Lanzani | Applied Data Science

IPython Notebook best practices for data science

IPython Notebook best practices for data science

Reproducible, One Button Workflows with the Jupyter Notebook & Scons | SciPy 2016 | Jessica Hamrick

Reproducible, One Button Workflows with the Jupyter Notebook & Scons | SciPy 2016 | Jessica Hamrick

Volodymyr (Vlad) Kazantsev - Clean Code in Jupyter notebooks, using Python

Volodymyr (Vlad) Kazantsev - Clean Code in Jupyter notebooks, using Python

Stephen Simmons - Pandas from the Inside /

Stephen Simmons - Pandas from the Inside / "Big Pandas"

Building Interactive Applications and Dashboards in the Jupyter Notebook

Building Interactive Applications and Dashboards in the Jupyter Notebook

© 2025 ycliper. Все права защищены.


  • Контакты
  • О нас
  • Политика конфиденциальности


Контакты для правообладателей: [email protected]