ycliper

Популярное

Музыка Кино и Анимация Автомобили Животные Спорт Путешествия Игры Юмор

Интересные видео

2025 Сериалы Трейлеры Новости Как сделать Видеоуроки Diy своими руками

Топ запросов

смотреть а4 schoolboy runaway турецкий сериал смотреть мультфильмы эдисон
Скачать

NASA Giovanni Tutorial

Автор: NASA HAQAST: Health and Air Quality Applied Sciences Team

Загружено: 2018-03-26

Просмотров: 9253

Описание: Giovanni is a flexible platform that allows a user to average remote-sensing data over time, create a range of plot types and formats, compare variables, and graphically display information.

Transcript:
Hello, this is Rhianna Miles, NASA HAQAST digital media specialist. Today I want to quickly show you NASA’s Giovanni. Giovanni is a flexible platform that allows a user to average remote-sensing data over time, create a range of plot types and formats, compare variables, and graphically display information.

I’m going to give you a basic introduction, but if you’d like a more detailed how-to, we’ve created a downloadable pdf version, which you can find on the HAQAST website: https://haqast.wiscweb.wisc.edu/wp-co...

We link to the Giovanni site on the HAQAST Tools page. You can get there by going to haqast.org. Under the ‘Tools and Resources’ tab, you’ll find a section called Tools. If you click on that, you can scroll down and find a link to Giovanni. If you click on Giovanni, it will bring you to the home page.

First, you need to select your Plot. I’d like a Time-Averaged map. I’m interested in nitrogen dioxide, so this type of map gives the average NO2 column over my region, for a selected time period. There are a few different maps you can choose from. Click the Details link beneath each to see which one is best suited for your purposes. The Time Averaged Map is what I’m looking for, so I’ll leave that highlighted.


Next, select a Date Range for which you would like to see data. I’m going to choose May 1st, 2016 to May 10th, 2016. You'll most likely choose a wider time period, but Time Averaged Maps take a long time to run, and the larger the date range, the more time you'll wait. Expect to be waiting for at least a few minutes, and possibly half an hour or so for wider ranges.

Now that I’ve chosen a date range, I need to choose the area that I’d like data for. You can either click on the bounding box to draw a box over the area you’d like data for, or you can select the shape of the area you’d like data for, which is useful if you’re interested in specific states, countries, or oceans. I’m interested in data for Wisconsin, so I’ll select Wisconsin.

Next, choose the variables you’d like to map. You can filter the measurements by discipline, but I’m just going to click on nitrogen dioxide. I’ll select the NO2 Tropospheric Column, and click ‘Plot Data.’

Now I’ll go get some coffee as my data is plotted…

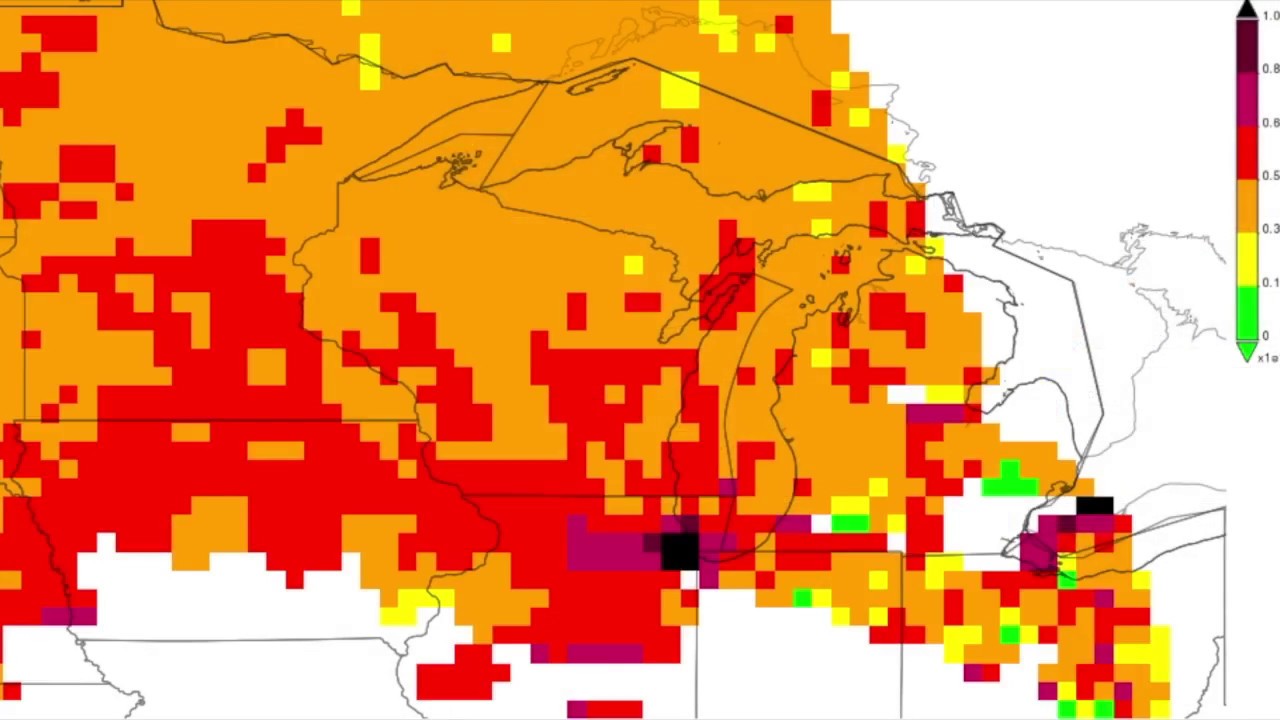
This is the default map that’s generated by Giovanni. This doesn’t show much over my region, so I will rescale the contours and color to be more informative. There we go, that’s better! Now I can see the high and low values more clearly. If you’d like to learn how to do this, follow the instructions in our written how-to on our website: https://haqast.wiscweb.wisc.edu/wp-co...

You can download this data for your own use. To do so, click Download (a) and when prompted, choose the file format that works best for your needs.


To find out more about Giovanni, including how to generate scatter plots and other visual outputs, or for more free NASA tools, how-tos, and useful links, visit HAQAST’s NASA Tools page: https://haqast.org/nasa-tools/. Thank you.

Не удается загрузить Youtube-плеер. Проверьте блокировку Youtube в вашей сети.
Повторяем попытку...
NASA Giovanni Tutorial

Поделиться в:

Доступные форматы для скачивания:

Скачать видео

  • Информация по загрузке:

Скачать аудио

Похожие видео

HAQAST St. Louis - Session 5B: Maximizing Value of Satellite Data for Environmental Consulting

HAQAST St. Louis - Session 5B: Maximizing Value of Satellite Data for Environmental Consulting

NASA ARSET: Basics of Synthetic Aperture Radar (SAR), Session 1/4

NASA ARSET: Basics of Synthetic Aperture Radar (SAR), Session 1/4

NASA ARSET: Platforms and Sensors for Observations, Data Access, and Processing Tools, Part 2/4

NASA ARSET: Platforms and Sensors for Observations, Data Access, and Processing Tools, Part 2/4

Российско-украинская война - на карте

Российско-украинская война - на карте

⚡ЛИПСИЦ: ЭТО КОНЕЦ! У Путина ВСЁ ПАРАЛИЗОВАНО – экономике ХАНА. РФ накрыл ЖУТКИЙ КРИЗИС

⚡ЛИПСИЦ: ЭТО КОНЕЦ! У Путина ВСЁ ПАРАЛИЗОВАНО – экономике ХАНА. РФ накрыл ЖУТКИЙ КРИЗИС

🔥Тегеран ПЫЛАЕТ! Израиль ударил ТУДА, куда Иран НЕ ЖДАЛ. Трамп В ЯРОСТИ.Срочно обратился к НЕТАНЬЯХУ

🔥Тегеран ПЫЛАЕТ! Израиль ударил ТУДА, куда Иран НЕ ЖДАЛ. Трамп В ЯРОСТИ.Срочно обратился к НЕТАНЬЯХУ

Картографирование невидимого: введение в спектральное дистанционное зондирование

Картографирование невидимого: введение в спектральное дистанционное зондирование

Владимир Жириновский дал прогноз по ситуации с Ираном

Владимир Жириновский дал прогноз по ситуации с Ираном

Как описана ВТОРАЯ МИРОВАЯ в учебниках ЯПОНИИ

Как описана ВТОРАЯ МИРОВАЯ в учебниках ЯПОНИИ

🔥Ходоренок РАЗОШЕЛСЯ! СКАЗАЛ ЭТО в прямом эфире! Соловьёв в БЕШЕНСТВЕ: ЖЁСТКО ОБЛАЖАЛСЯ на шоу

🔥Ходоренок РАЗОШЕЛСЯ! СКАЗАЛ ЭТО в прямом эфире! Соловьёв в БЕШЕНСТВЕ: ЖЁСТКО ОБЛАЖАЛСЯ на шоу

Learn How to Discover, Access, and Customize Multiple Datasets Using Earthdata Search

Learn How to Discover, Access, and Customize Multiple Datasets Using Earthdata Search

HAQAST St. Louis - Session 3A: Forecasting & Near-RT Monitoring Smoke & Impacts from Wildland Fires

HAQAST St. Louis - Session 3A: Forecasting & Near-RT Monitoring Smoke & Impacts from Wildland Fires

SHAZAM Top 50🏖️Лучшая Музыка 2025🏖️Зарубежные песни Хиты🏖️Популярные Песни Слушать Бесплатно #40

SHAZAM Top 50🏖️Лучшая Музыка 2025🏖️Зарубежные песни Хиты🏖️Популярные Песни Слушать Бесплатно #40

RUS Webinar: Air quality monitoring with Sentinel-5P - ATMO01

RUS Webinar: Air quality monitoring with Sentinel-5P - ATMO01

HAQAST St. Louis - Session 4A: Remote Sensing for Remote Regions: Improving Decision-Making

HAQAST St. Louis - Session 4A: Remote Sensing for Remote Regions: Improving Decision-Making

Tutorial: Descarga de Datos de Precipitación del Satélite TRMM (NASA) - Interfaz Giovanni -

Tutorial: Descarga de Datos de Precipitación del Satélite TRMM (NASA) - Interfaz Giovanni -

ЗВІЛЬНЕННЯ територій, відключення Starlink, ПАНІКА рф | СПРАВЖНІ деталі про наступ під Запоріжжям

ЗВІЛЬНЕННЯ територій, відключення Starlink, ПАНІКА рф | СПРАВЖНІ деталі про наступ під Запоріжжям

Digital Elevation Models in GIS (theory) - updated

Digital Elevation Models in GIS (theory) - updated

Getting Started with NASA Worldview

Getting Started with NASA Worldview

NASA Earthdata Webinar Series: Giovanni - Access and Visualize Earth Science Data Online

NASA Earthdata Webinar Series: Giovanni - Access and Visualize Earth Science Data Online

© 2025 ycliper. Все права защищены.


  • Контакты
  • О нас
  • Политика конфиденциальности


Контакты для правообладателей: [email protected]