Analysis of One Quantitative Variable, part 1, 215 R Project
Автор: R You Ready for Stats?
Загружено: 2026-01-13
Просмотров: 0
Описание:
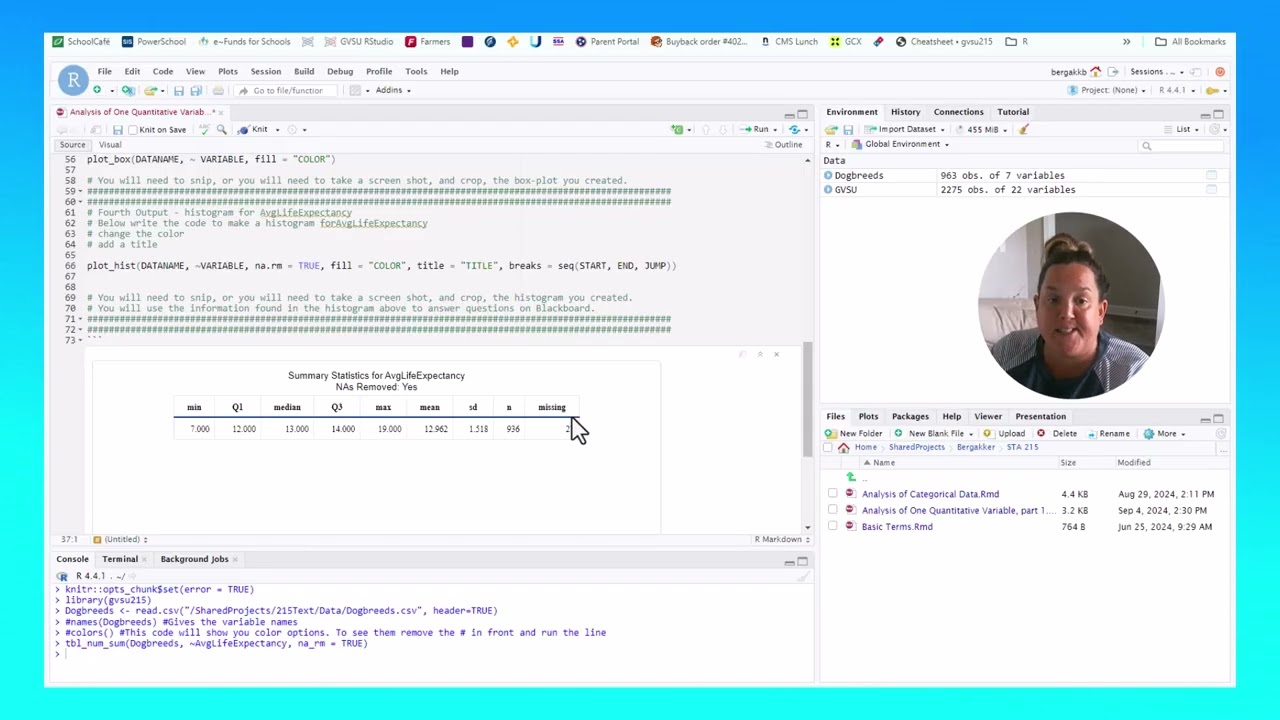
This video walks through Part 1 of the STA 215 R Project: Analysis of One Quantitative Variable, focusing on how to describe and summarize a single quantitative variable using the gvsu215 package.
The emphasis in this video is on understanding what numerical summaries and visualizations tell us about the distribution of a variable, not just on running the code. Students are guided through how to generate appropriate summaries and how to connect R output to meaningful statistical interpretation for a project write-up.
Specifically, this video demonstrates how to:
Create numerical summaries of a quantitative variable using
tbl_num_sum(DATANAME, ~VARIABLE, na_rm = TRUE)
and explain measures of center and spread in context.
Calculate selected percentiles with
tbl_pctile(DATANAME, ~VARIABLE, probs = c(PERCENTILE))
and interpret what these values represent about the distribution.
Visualize the distribution using a boxplot with
plot_box(DATANAME, ~VARIABLE, fill = "COLOR")
and identify features such as skewness, spread, and potential outliers.
Create and interpret a histogram using
plot_hist(DATANAME, ~VARIABLE, na.rm = TRUE, fill = "COLOR", title = "TITLE", breaks = seq(START, END, JUMP)),
with attention to choosing appropriate bin widths and describing overall shape.
Throughout the video, attention is given to how these summaries and plots work together to provide a complete description of a quantitative variable, as expected in STA 215 project submissions. This video is intended to support students as they work independently on their R projects and to clarify common points of confusion related to interpretation and explanation.
Повторяем попытку...
Доступные форматы для скачивания:
Скачать видео
-
Информация по загрузке:


