IB Math 4.2.1 Presentation of Data Made Easy
Автор: The Bearded Math Man
Загружено: 2025-08-17
Просмотров: 210
Описание:
In this video, we cover:
✔️ Why averages alone don’t tell the full story in statistics
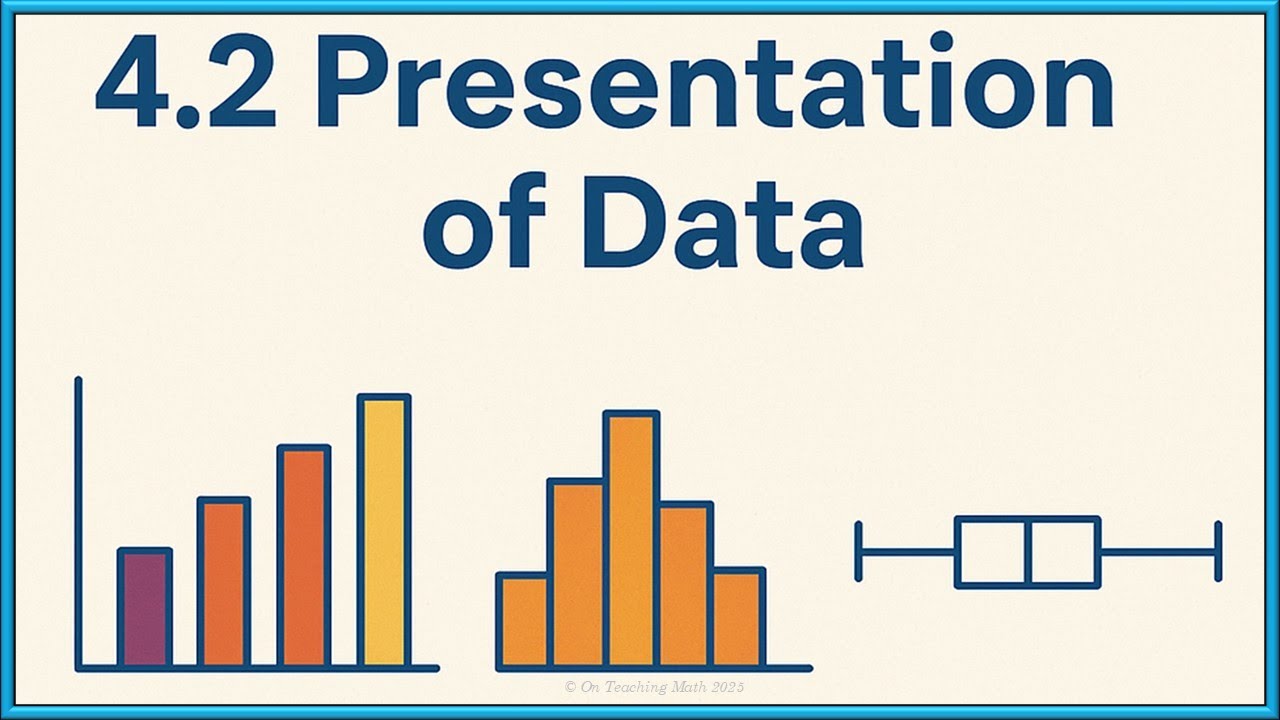
✔️ When to use a bar graph (discrete/categorical data)
✔️ When to use a histogram (continuous/grouped data)
✔️ How to construct and interpret a box-and-whisker plot
✔️ Step-by-step example with real data (student mile times)
This lesson is fully aligned with the IB syllabus and uses IB-style language, notation, and rigor so you’re practicing exactly what you’ll see on your exams. By the end, you’ll know not only how to draw graphs correctly, but also how to interpret them for real-world meaning and IB assessments.
https://thebeardedmathman.com/ib-math...
Повторяем попытку...
Доступные форматы для скачивания:
Скачать видео
-
Информация по загрузке:


![Topic 4 - Statistics and Probability [IB Math AI HL]](https://image.4k-video.ru/id-video/PLrVxQwkfAdPSwF2r5p0keFQqVIfwis0q7)


