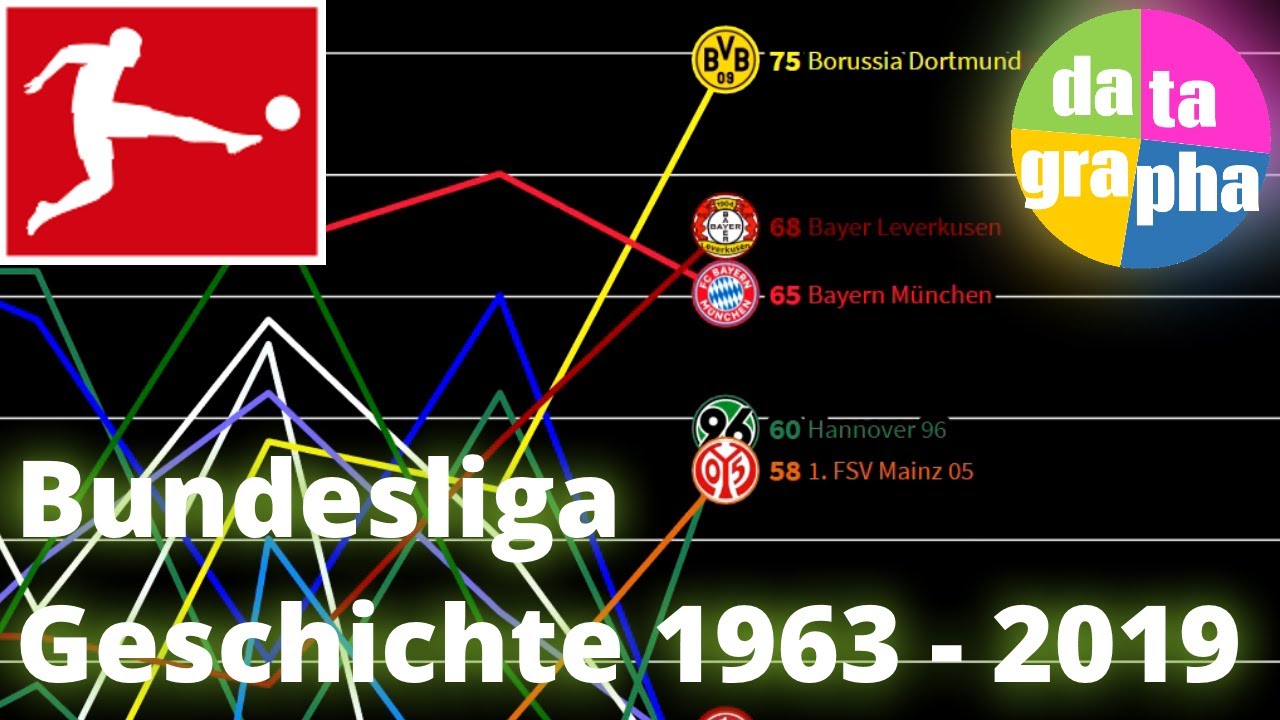
Bundesliga history: all seasons visualized, 1963 - 2019
Автор: DataGrapha
Загружено: 2019-05-28
Просмотров: 1843
Описание:
Animated graph showing the points of each team at the end of the season plus all official end of season tables for Deutsche Bundesliga.
For easier comparability, the graph converts points to the newer 3-point rule (3 points for a victory instead of 2), and scales up points for the first two seasons, where only 16 teams instead of 18 competed.
Music: Music-Electrifier - Radio Active ( / kyle-ives )
Data sources:
1)James P. Curley (2016). engsoccerdata: English Soccer Data 1871-2016. R package version 0.1.5,
2)www.kicker.de
Check out my channel for (upcoming) videos about other leagues, as well as similar videos of other sports and stuff.
Have fun! :)
Music: Music-Electrifier - Radio Active ( / kyle-ives )
Data source: James P. Curley (2016). engsoccerdata: English Soccer Data 1871-2016. R package version 0.1.5, www.kicker.de
#datagrapha
Повторяем попытку...

Доступные форматы для скачивания:
Скачать видео
-
Информация по загрузке: