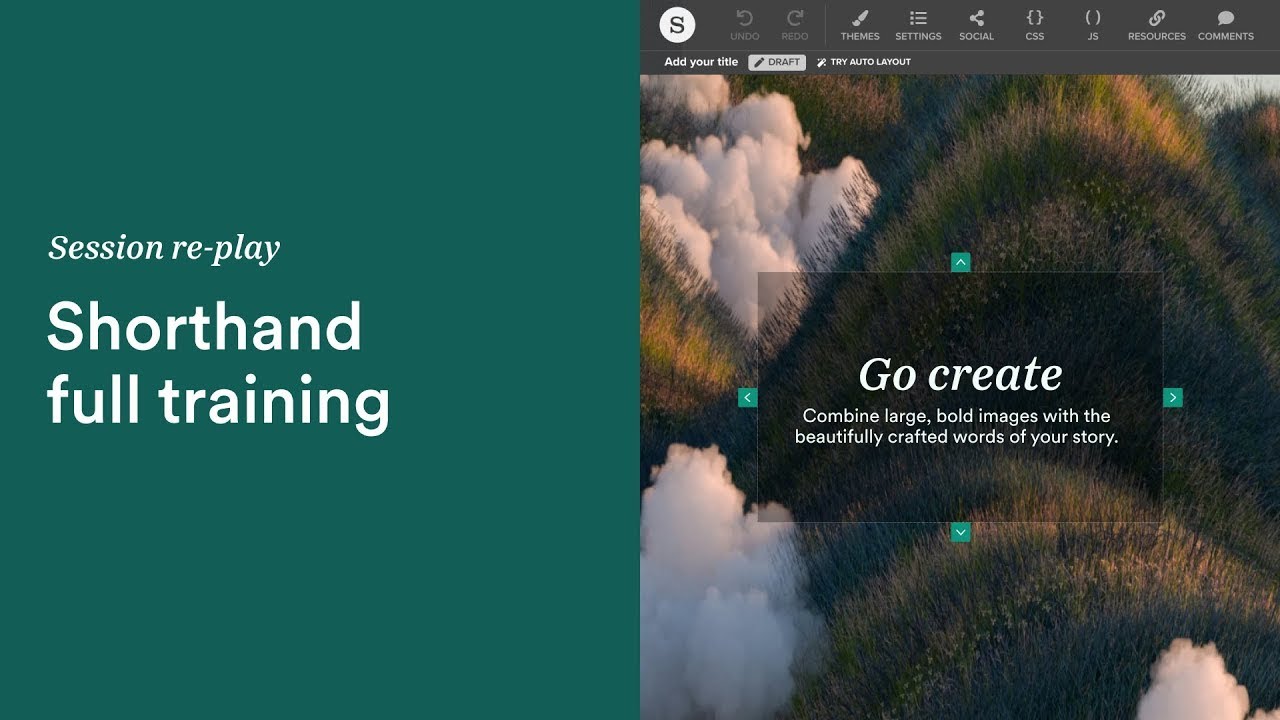
8 data visualization examples to enhance your storytelling with Shorthand
Автор: Shorthand
Загружено: 2022-04-05
Просмотров: 13977
Описание:
Over the last five years, we’ve seen an explosion in excellent data storytelling.
A big part of this story has been the rise of data journalism. But we’ve also seen data storytelling from content teams across brands, NGOs, universities, and more.
Some of the most acclaimed data stories have been produced by specialist data visualization and data science teams — most famously at the New York Times and Five Thirty Eight. Many of these interactive stories are truly stunning examples of what can be done with modern web browsers.
Here’s the problem, though: few (if any) content teams have the development resources of the Times. If all data storytelling relied on a team of data scientists and web developers, then we wouldn’t see very many data-driven stories.
Happily, this isn’t the case. Nearly every media company in the world is publishing data stories, with data journalism becoming an increasingly sought-after skill.
Even beyond media, we’re seeing stunning data visualisations from content marketing teams at businesses, non-profits, universities, and more.
What’s going on?
In this video — hosted by Shorthand's Editorial Success Manager, Jade Graddy — we introduce eight stunning examples of data storytelling.
Looking for more inspiration for your visual content? Sign up to Shorthand's newsletter, which rounds up the best digital content on the web: https://shorthand.com/the-craft/add-t...
And if you're looking for the original guide on The Craft: https://shorthand.com/the-craft/examp...
Stay connected with Shorthand! Follow us for content inspiration and to learn how to create immersive visual content for the web.
LinkedIn: / shorthandapp
Twitter: / shorthand
Instagram: / shorthandco
Повторяем попытку...

Доступные форматы для скачивания:
Скачать видео
-
Информация по загрузке: