Stock Selection & Trading Psychology Explained | Beginner Guide
Автор: LearnStack
Загружено: 2026-03-18
Просмотров: 33
Описание:
Trading Psychology: Mental and Emotional Factors Defining Trader Decisions
Trading psychology refers to the mental and emotional factors that shape a trader's decisions and behavior . Even with strong technical analysis (chart patterns, indicators) or fundamental analysis (company financials), poor psychology leads to failure because emotions override rational strategies, separating successful traders from others . Emotions like fear, greed, excitement, and frustration drive impulsive decisions, undermining predefined plans.
Common emotional pitfalls include:
• Fear of Missing Out (FOMO): Seeing a stock rise or others buying triggers entry into trades outside one's strategy, driven by thoughts like "This will go higher; I can't miss it" . This ignores risk, leading to losses as the rally fades.
• Greed (Holding Beyond Targets): After hitting a profit target, rumors of further upside prevent selling ("It'll go much higher"). Price may retrace below entry, turning profits into losses
.
• Panic Selling: During market drops (e.g., bad news), traders exit before stop-loss hits, despite strategy dictating hold within stop-loss to target range .
• Revenge Trading: After a stop-loss hit, impulsive re-entry without research to recover losses fails due to skipped risk management .
Patience, emotion control, and discipline form the foundation of successful trading psychology; without them, survival is impossible .
A strong mindset involves creating a strategy first, risking only on fitting stocks with fixed plans (entry price, stop-loss for small loss, profit target), and ignoring external noise .
Market Unpredictability and Controlling Behavior
Markets are unpredictable, especially short-term, due to volatility from company news, national events, or political instability—no one predicts direction reliably . Traders can't control trade outcomes but can control behavior by sticking to plans.
Small, consistent growth beats aggressive high expectations:
• High expectations increase risk; low ones with fixed risk-reward (e.g., risk 2%−3%2%−3% for 4%−6%4%−6% target) compound over time .
• Achieving 5%5% monthly portfolio growth via consistency outperforms 90%90% of traders .
Compounding amplifies small gains: Consistent execution leverages this mathematical growth where returns build on prior gains .
Growth Strategy Mechanism Outcome
Aggressive (high risk, big targets) Chases quick wins, ignores psychology High failure rate due to emotions
Consistent (small risks, 1:21:2 reward) Fixed plan + patience Compounds to beat 90%90% traders
Success isn't finding the "best strategy" (none is perfectly profitable always) but managing psychology and protecting capital—losses are normal; long-term consistency wins .
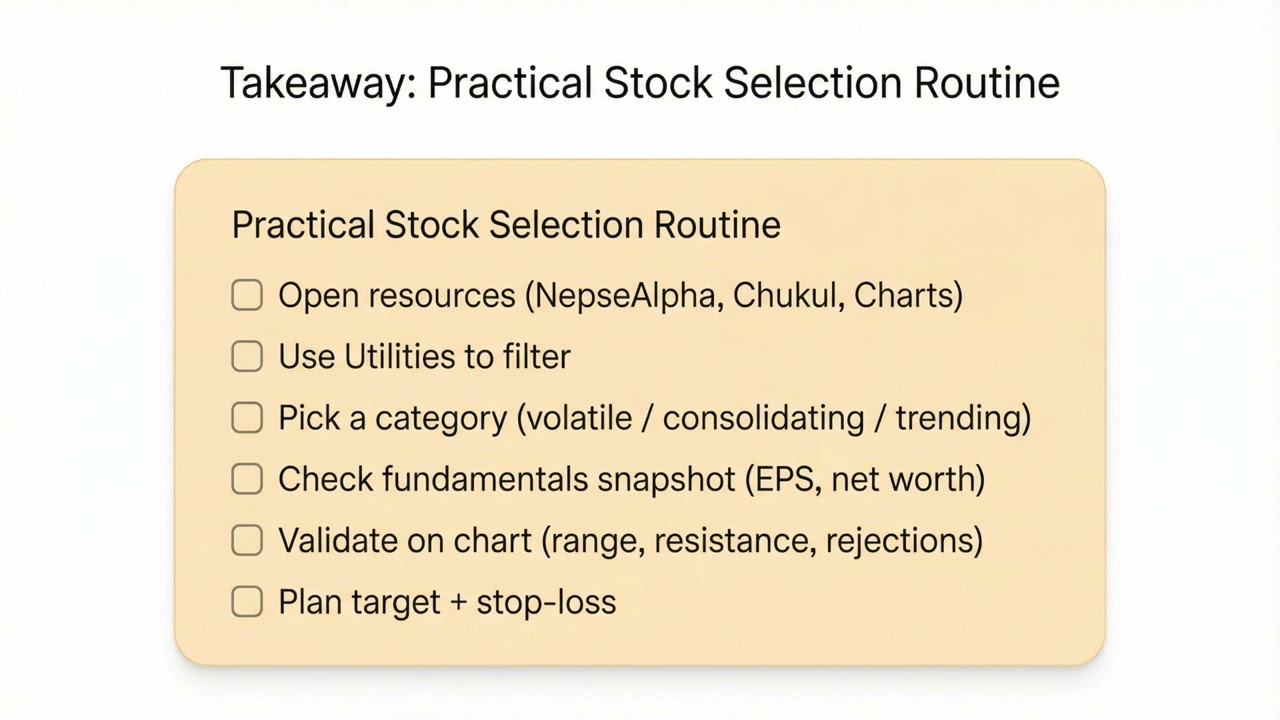
Trade Management Rules for Discipline
Define trades clearly: Fix stop-loss (cut loss level) and targets before entry . While price stays between them, wait and watch—no action needed .
• Profit Hit: Book partial profits near target (e.g., 50%50%), trail remainder upward .
• Stop-Loss Hit: Exit fully or partially to limit damage.
This enforces discipline amid emotions.
Stock Selection Process on NepseAlpha.com
Access nepsealpha.com for Trading Signals for screening .
Candlestick Signals
Filter by timeframes (daily, weekly, hourly, 55-min, 1515-min, 3030-min) and patterns :
• E.g., Doji (indecision candle): Click "Doji" to list stocks forming it .
• Example: MKHL (price 740740): EPS (Earnings Per Share: profit per share) 0.830.83 (poor), book value (net assets per share) 101.74101.74 (decent), P/E ratio (Price-to-Earnings: valuation multiple) high (ignore for short-term trading) .
• Chart shows Doji at resistance (price barrier); use breakout strategy—buy above red candle base, target next resistance .
Other patterns:
• Bullish Engulfing, Hammer, Bullish Harami (reversal signals).
• Three White Soldiers (uptrend confirmation).
• Bearish Engulfing .
Doji works if at support (buy zone) or resistance (breakout setup) .
Fundamental Signals
Screens undervalued/overvalued via P/E, Price-to-Book ratios .
• Example: NBL (Nepal Bank Limited, LTP 251251): P/E 8.68.6, P/B 11 (undervalued; potential to 3×3× price long-term) .
Technical Screener
Filter by indicators/strategies:
• RSI (Relative Strength Index: momentum oscillator) -30-30 (oversold) .
• MACD (Moving Average Convergence Divergence: trend/momentum).
• Price above/below 200200-SMA (Simple Moving Average: trend line) .
• Example: EKPL (price range with RSI 2020—good for trading) .
• Chart: Past breakout achieved first target; trailed stop-loss on pullback
.
• Always check volume (trading activity confirming moves) .
Повторяем попытку...

Доступные форматы для скачивания:
Скачать видео
-
Информация по загрузке:


![JAKI SEKRET SKRYWA *LILY* z POPPY PLAYTIME CHAPTER 5 *fabuła i ciekawostki* [cz.4]](https://imager.clipsaver.ru/CdB-W4hcBrA/max.jpg)