ggplot2 08 Annotations
Автор: Statistics Ninja
Загружено: 2026-02-15
Просмотров: 8
Описание:
*ggplot2 Annotations Tutorial — Titles, Labels, ggrepel, ggtext, directlabels, ggforce, gghighlight*
In this lecture, we explore one of the most powerful but often overlooked parts of **ggplot2**: **annotations**. Using real R code and reproducible examples, we walk through how to add titles, mathematical expressions, text labels, highlights, reference lines, and custom annotations to your visualizations.
This lesson is based on material adapted from the ggplot2: Elegant Graphics for Data Analysis textbook by Hadley Wickham, Danielle Navarro, and Thomas Lin Pedersen, with additional demonstrations using packages from the broader ggplot2 ecosystem.
---
*What You’ll Learn*
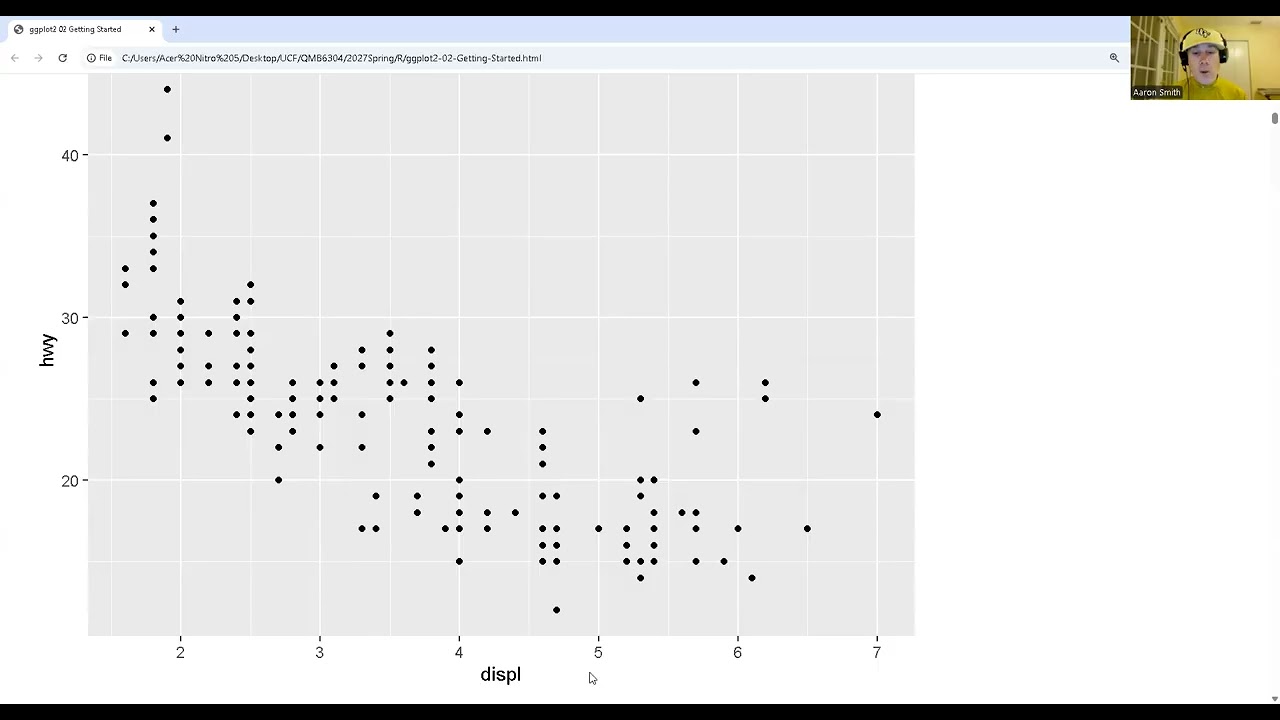
*1. Plot & Axis Titles*
Using `labs()` for titles, subtitles, axis labels, and legend titles
Adding mathematical expressions with `plotmath`
Enabling markdown formatting in titles using *ggtext*
*2. Text Labels & Fonts*
Using `geom_text()` and `geom_label()`
Font families, fontface, alignment (`hjust`, `vjust`), rotation, and sizing
Avoiding overlapping labels with *ggrepel*
Fitting text inside shapes with *ggfittext*
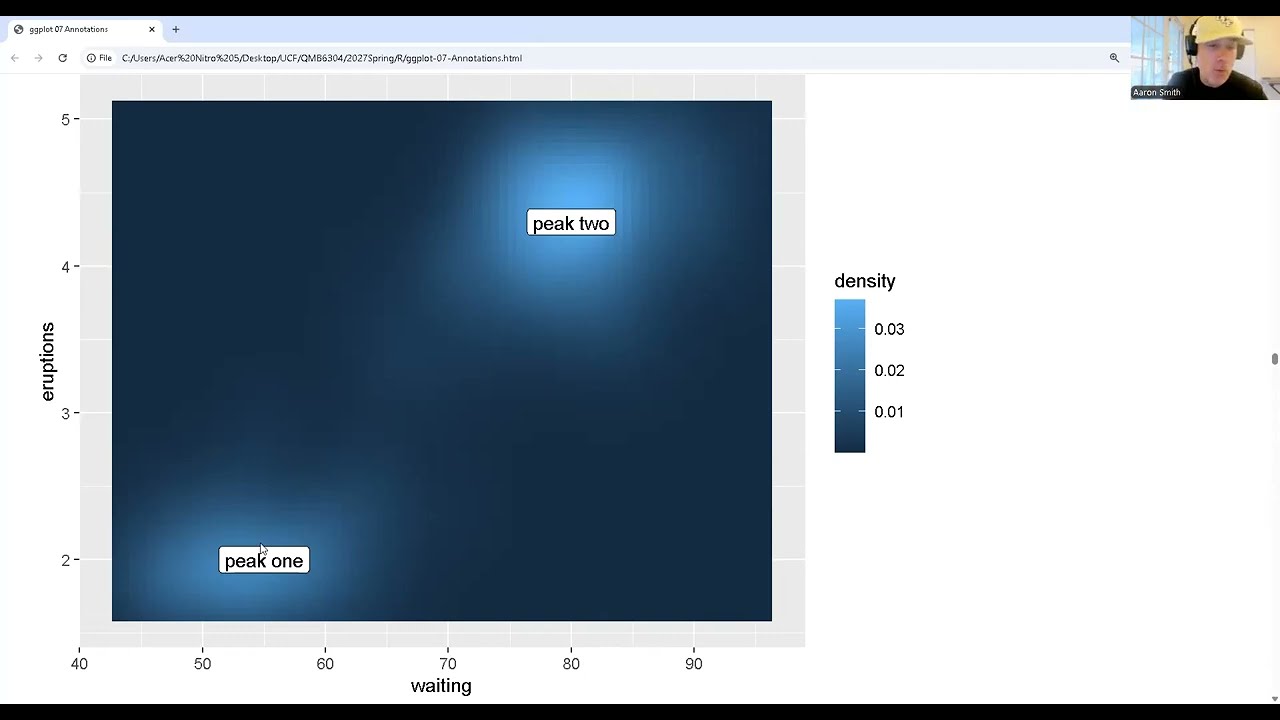
*3. Custom Annotations*
Highlighting regions with `geom_rect()`
Adding reference lines with `geom_vline()`, `geom_hline()`, and `geom_abline()`
Using `annotate()` for single annotations
Drawing curves and arrows with `geom_curve()` and `geom_segment()`
*4. Direct Labeling Techniques*
Labeling groups directly on the plot using *directlabels*
Highlighting subsets with *gghighlight*
Using *ggforce* tools like `geom_mark_ellipse()` for visual grouping
*5. Annotation Across Facets*
Adding shared reference lines across facets
Highlighting groups within faceted plots for easier comparison
---
*Packages Featured*
*ggplot2*
*ggtext*
*ggrepel*
*ggfittext*
*directlabels*
*ggforce*
*gghighlight*
**dplyr**, **magrittr**, and more
---
*About This Series*
This video is part of my ongoing lecture series for Data Visualization at the University of Central Florida. All examples are fully reproducible and designed to help students and data analysts build strong, modern data visualization skills in R.
---
*Resources*
ggplot2 Book: https://ggplot2-book.org
ggplot2 GitHub: https://github.com/hadley/ggplot2-book
UCF Library Access (students): https://library.ucf.edu
---
Like the video and subscribe for more R and data visualization tutorials.
Повторяем попытку...
Доступные форматы для скачивания:
Скачать видео
-
Информация по загрузке: