InfoVis from Eindhoven
Автор: SCIInstitute
Загружено: 2011-04-21
Просмотров: 281
Описание:
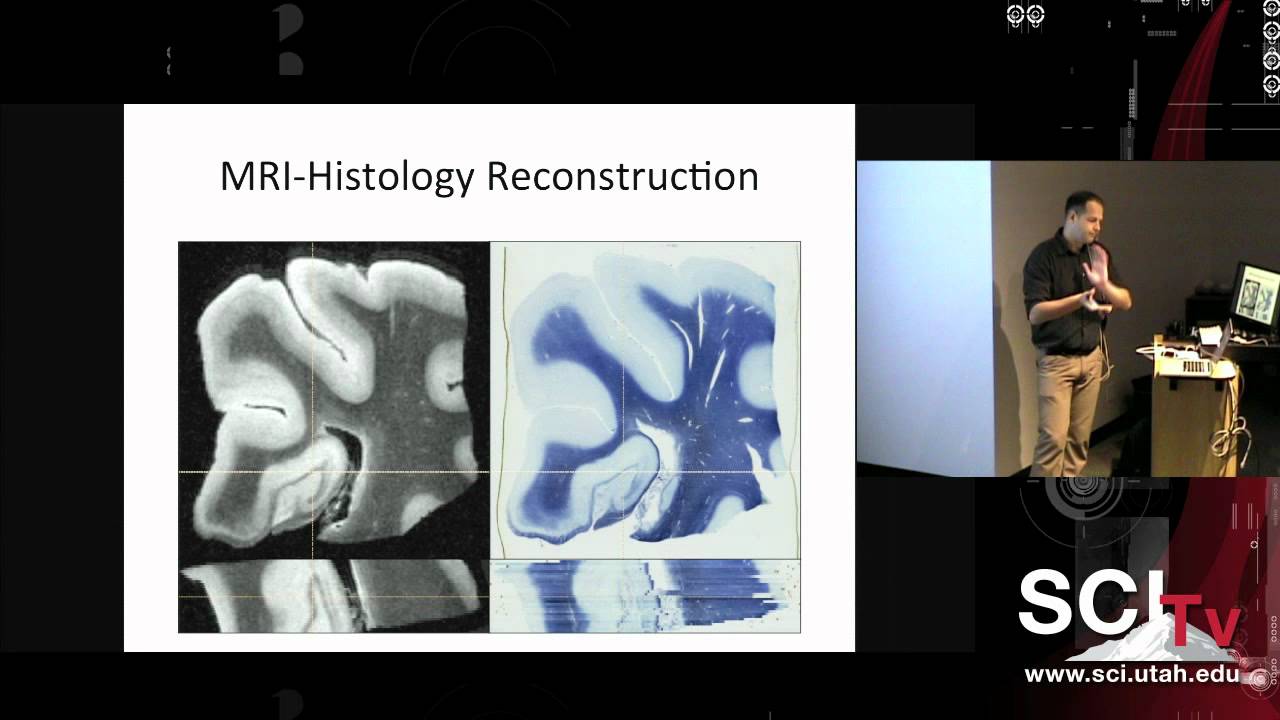
An overview will be given of work of the visualization group of Eindhoven University of Technology, The Netherlands. One focus of the group is to develop new visual representations that convey large amounts of data or complex phenomena effectively in short time, using techniques from computer graphics. A variety of examples are shown, using animations and demos.
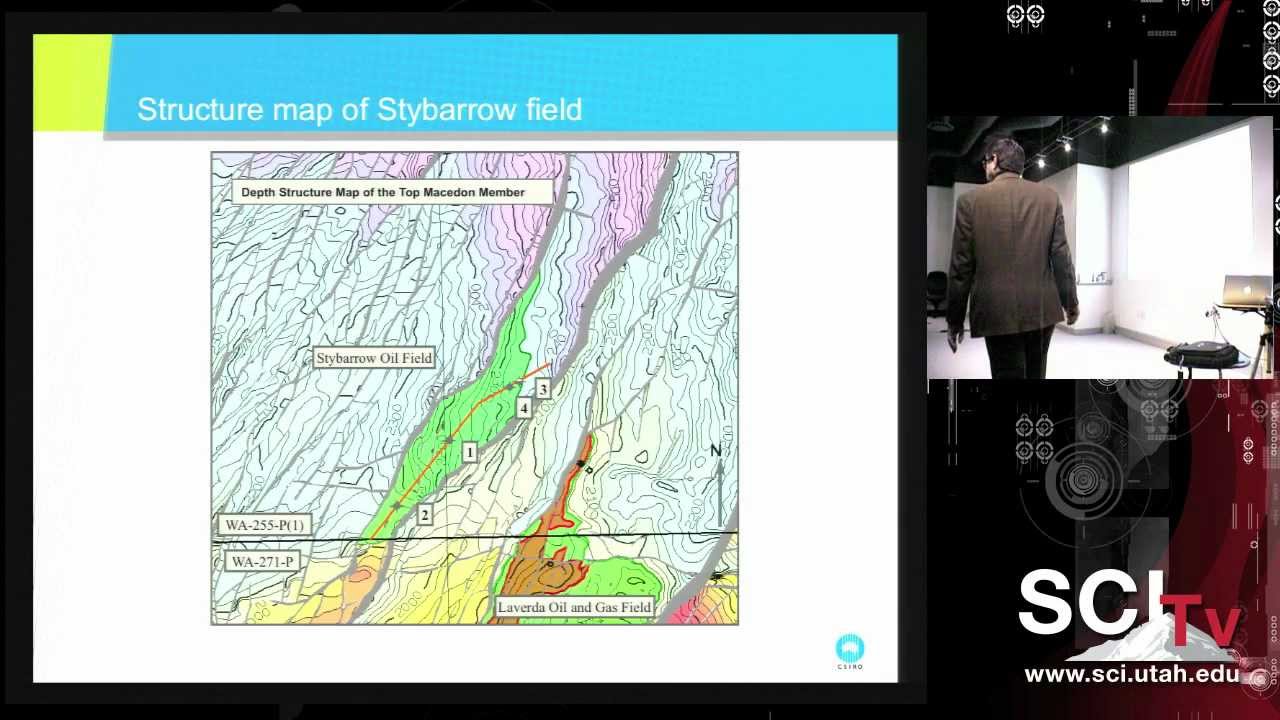
The group has worked on a variety topics, and some examples from flow visualization, mathematical visualization, and cartography are given. The main focus is information visualization, with the analysis of software systems as the main application. We have worked on the visualization of trees, graphs, and combinations of these. This has led to techniques such as cushion treemaps, botanic visualization, the use of incidence matrices and hierarchical edge bundles. Besides the development of new visual representations, we increasingly perform user experiments to evaluate the perception of visual representations. Examples from graph drawing and multivariate data visualization are given.
Повторяем попытку...

Доступные форматы для скачивания:
Скачать видео
-
Информация по загрузке: