Скачать
Graphing max and min lines in logger pro
Автор: Paul Williamson
Загружено: 2020-02-05
Просмотров: 691
Описание:
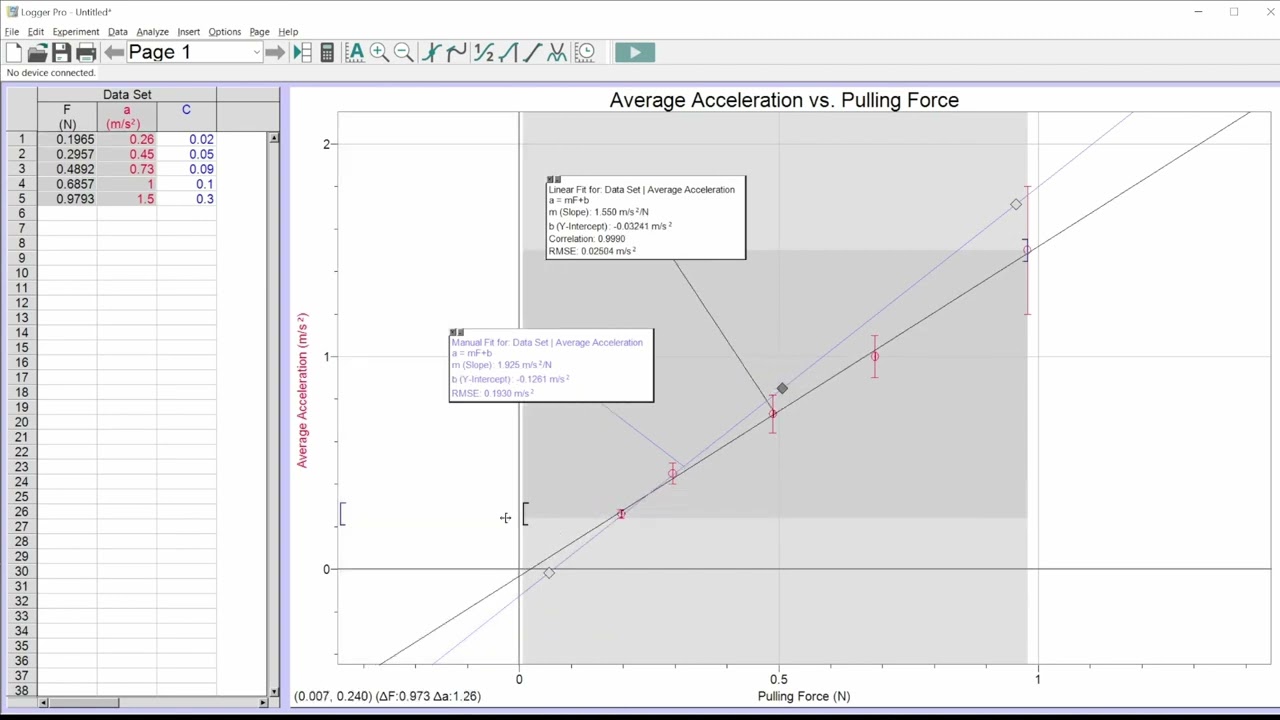
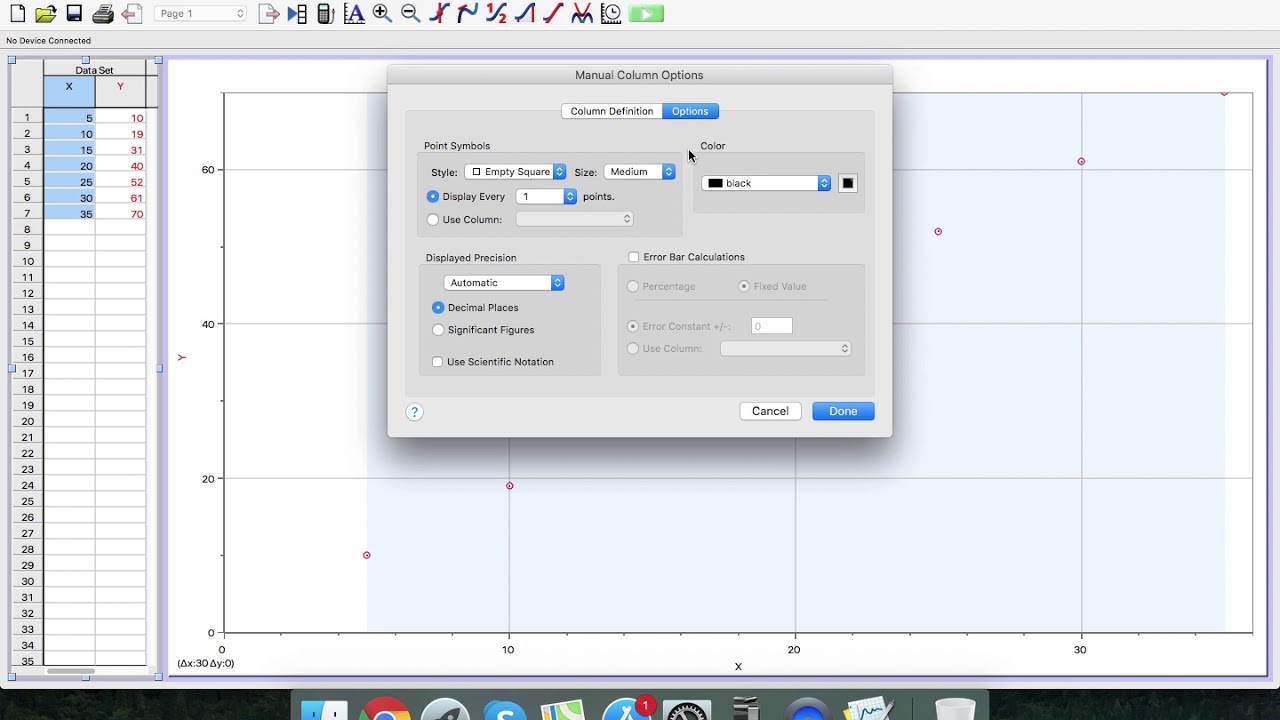
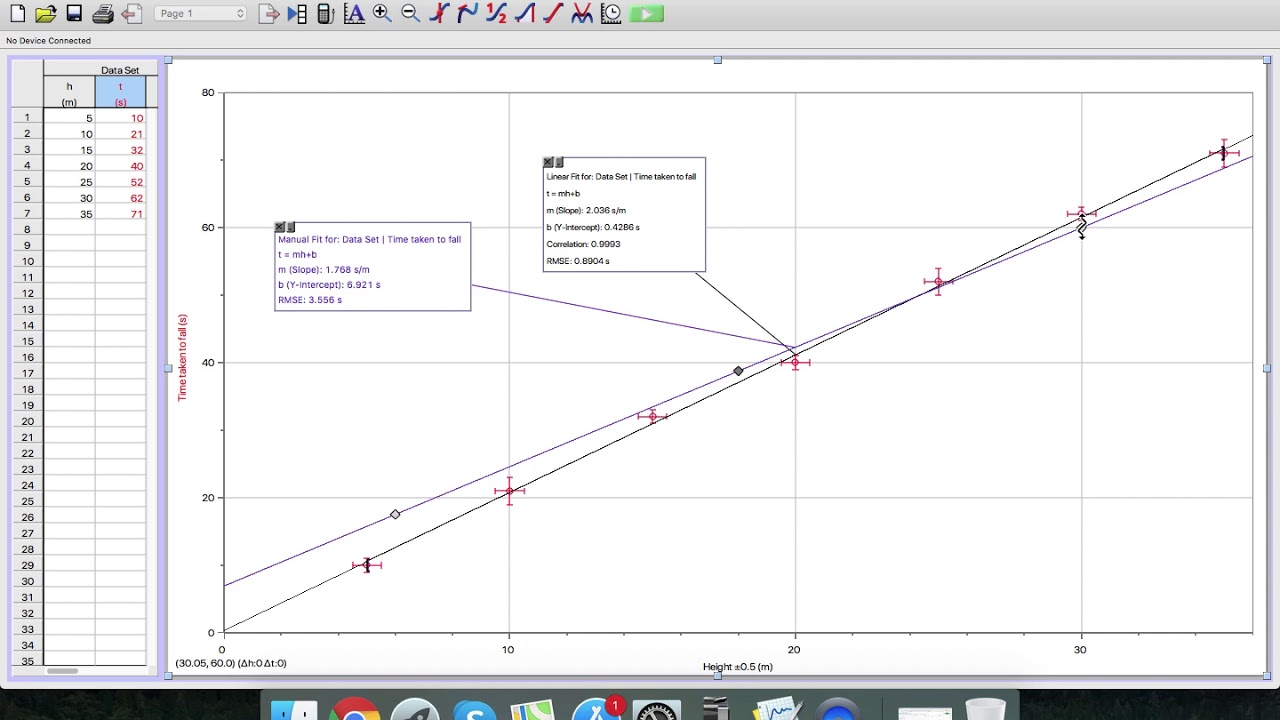
This is a short video that takes you through the process of adding maximum and minimum lines of best fit to a graph in Logger Pro.
Note the value of the gradient is 2.0±0.2
In IB Physics we take the uncertainty to 1 significant figure and there is no requirement that the lines are defined by specific data points. It should be noted that the limits of your data set are often the most unreliable points you have.
Не удается загрузить Youtube-плеер. Проверьте блокировку Youtube в вашей сети.
Повторяем попытку...
Повторяем попытку...
Доступные форматы для скачивания:
Скачать видео
-
Информация по загрузке: