Cause and effect diagram DCS instrumentation | Part 12
Автор: Aadil Chohan
Загружено: 2021-12-29
Просмотров: 2949
Описание:
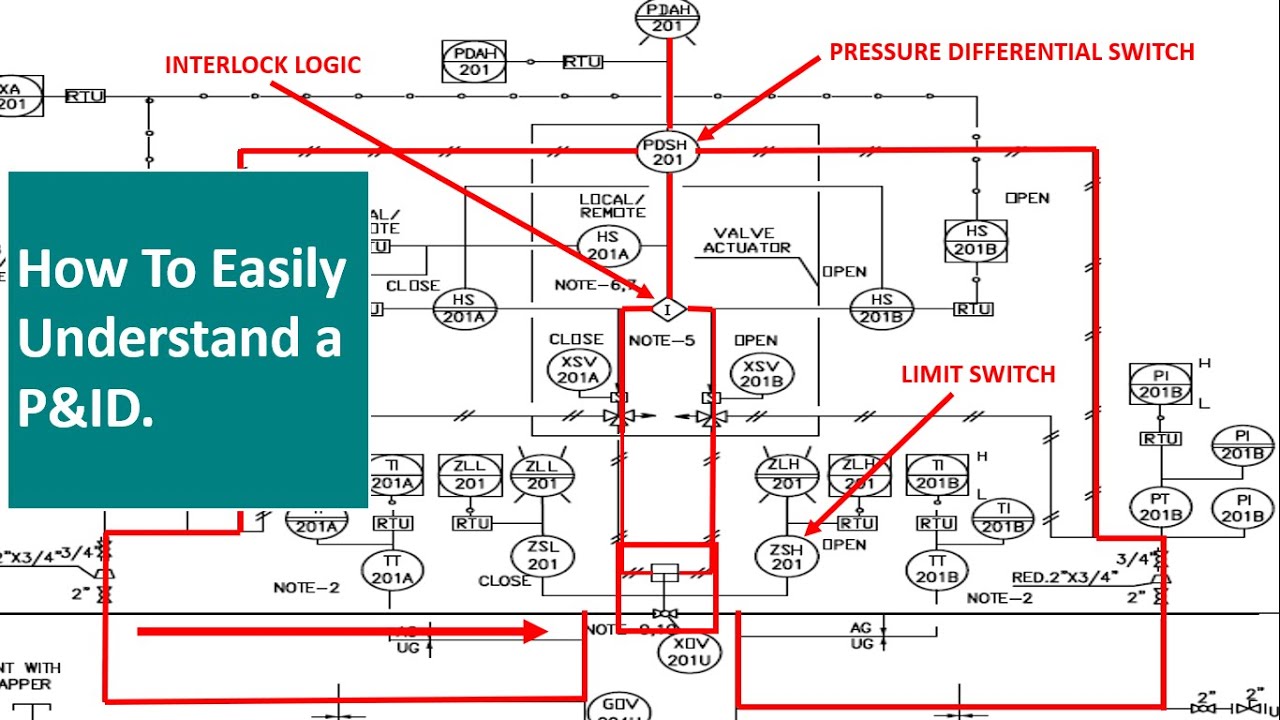
In this video, we are explaining Cause and effect diagram DCS instrumentation.
Learn how to create a cause-and-effect diagram, also known as an Ishikawa or "fishbone" diagram, to explore and display the possible causes of a certain effect.
Regards:
Aadil Chohan
Please Subscribe us
/ @learnoilandgas
How to read blueprints
• How to read blueprint for construction || ...
Pressure transmitter calibration procedure in hindi
• Pressure Transmitter Calibration | Pressur...
Flow meter calibration setup
• Видео
Follow us on facebook
/ adilchohan44
subscribe us
/ aadilchohan
Повторяем попытку...

Доступные форматы для скачивания:
Скачать видео
-
Информация по загрузке: