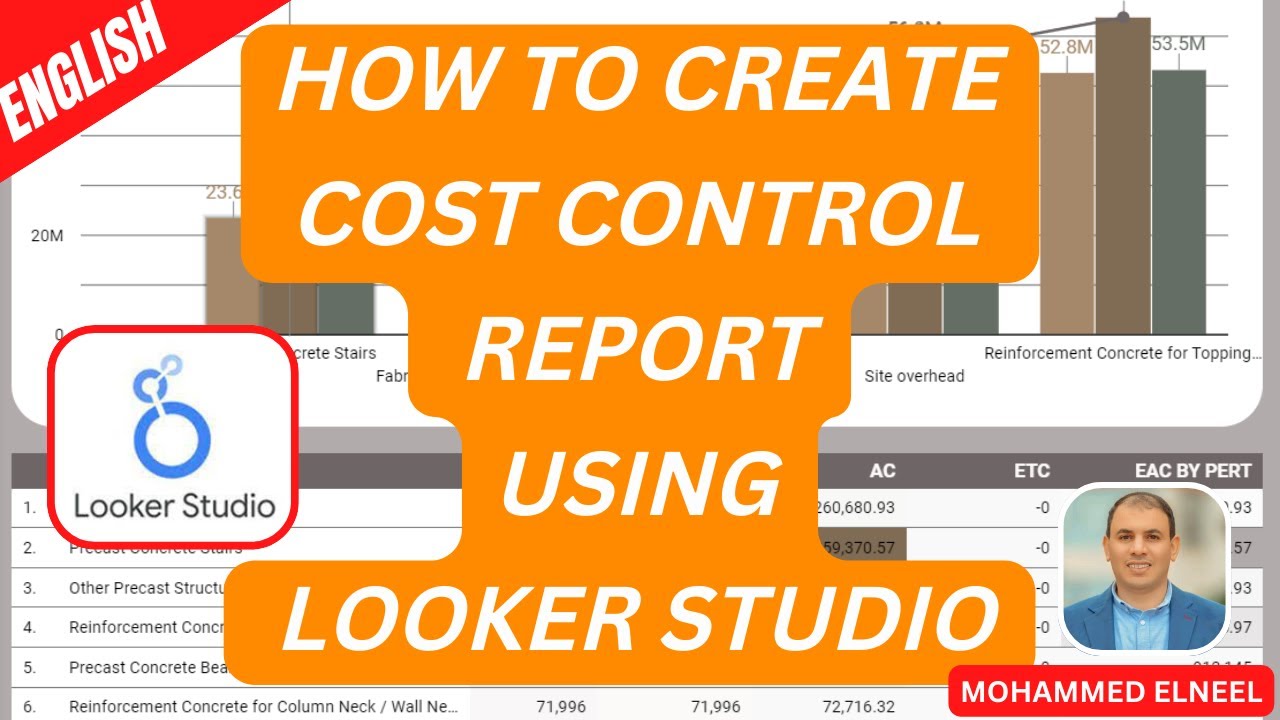
Mastering Cost Control Reports in Looker Studio | Step-by-Step Tutorial
Автор: PMO PREMIUM
Загружено: 2024-03-01
Просмотров: 616
Описание:
Phase 1: Setup & Configuration
00:00 – Review Google Sheets columns (Serial No, Control Point, Activity, Discipline, etc.).
00:27 – Connect Google Sheets data source to Looker Studio.
01:03 – Open "Theme and Layout" settings.
01:14 – Change Canvas Size: Width to 1500px, Height to 1200px.
Phase 2: Filters (Controls)
01:51 – Add Drop-down list for Control Point.
02:08 – Add Drop-down list for Activity.
02:16 – Add Drop-down list for Discipline.
Phase 3: Visualizations (Charts & Tables)
02:40 – Add Combo Chart (Line & Bar).
03:00 – Set Chart Metrics: Planned Value, Earned Value, Actual Cost.
03:31 – Configure Chart Style: Enable "Cumulative," "Show Points," and "Compact Numbers".
04:30 – Add Scorecard: Planned Value.
04:39 – Add Scorecard: Earned Value.
04:54 – Add Scorecard: Actual Cost.
05:25 – Add Table with columns: Activity, Planned Value, Earned Value, Actual Cost.
05:52 – Enable "Show Summary Row" for the table.
Phase 4: Custom Formulas (Calculated Fields)
06:15 – Create SPI (Schedule Performance Index) field.
Formula: SUM(Earned Value) / SUM(Planned Value).
07:50 – Create CPI (Cost Performance Index) field.
Formula: SUM(Earned Value) / SUM(Actual Cost).
09:30 – Create TCPI (To Complete Performance Index) field.
Formula: (SUM(Budget at Completion) - SUM(Earned Value)) / (SUM(Budget at Completion) - SUM(Actual Cost)).
10:49 – Debugging TCPI errors (fixing aggregation issues by ensuring SUM is applied correctly).
Phase 5: Design & Formatting
12:55 – Add rectangular shapes to create background sections for the header and KPIs.
13:51 – Add Text Box for Dashboard Title: "Cost Control Report using Looker Studio".
14:15 – Extract Theme from Image: Upload an image to automatically generate a color palette for the dashboard.
14:48 – Apply the extracted theme colors to the background and charts.
Phase 6: Final Review
15:38 – Test the filters and review the final dashboard layout.
In this video, I will walk you through the complete process of creating a professional Project Cost Control Dashboard using Google Looker Studio. Whether you are a Project Manager, a Project Controller, or a Data Analyst, this tutorial will help you visualize your data effectively.
Time line
🚀 What you will learn in this tutorial:
Data Connection: How to connect Google Sheets to Looker Studio.
Page Setup: Adjusting canvas size and layout for a professional view.
Visualizations: Creating Combo Charts (to compare progress) and detailed Tables with heatmaps.
Custom Metrics (Math): How to create calculated fields for SPI (Schedule Performance Index) and CPI (Cost Performance Index) using formulas.
KPI Cards: Displaying compact numbers for Planned Value, Earned Value, and Actual Cost.
Design Tricks: How to add a custom background image to make your dashboard look like "magic."
🧮 Formulas used in this video:
SPI (Schedule Performance Index): SUM(Earned Value) / SUM(Planned Value)
CPI (Cost Performance Index): SUM(Earned Value) / SUM(Actual Cost)
Estimate at Completion: Custom formulas based on your project requirements.
📊 Tools used:
Google Sheets
https://docs.google.com/spreadsheets/...
Google Looker Studio
https://lookerstudio.google.com/repor...
Повторяем попытку...
Доступные форматы для скачивания:
Скачать видео
-
Информация по загрузке:


