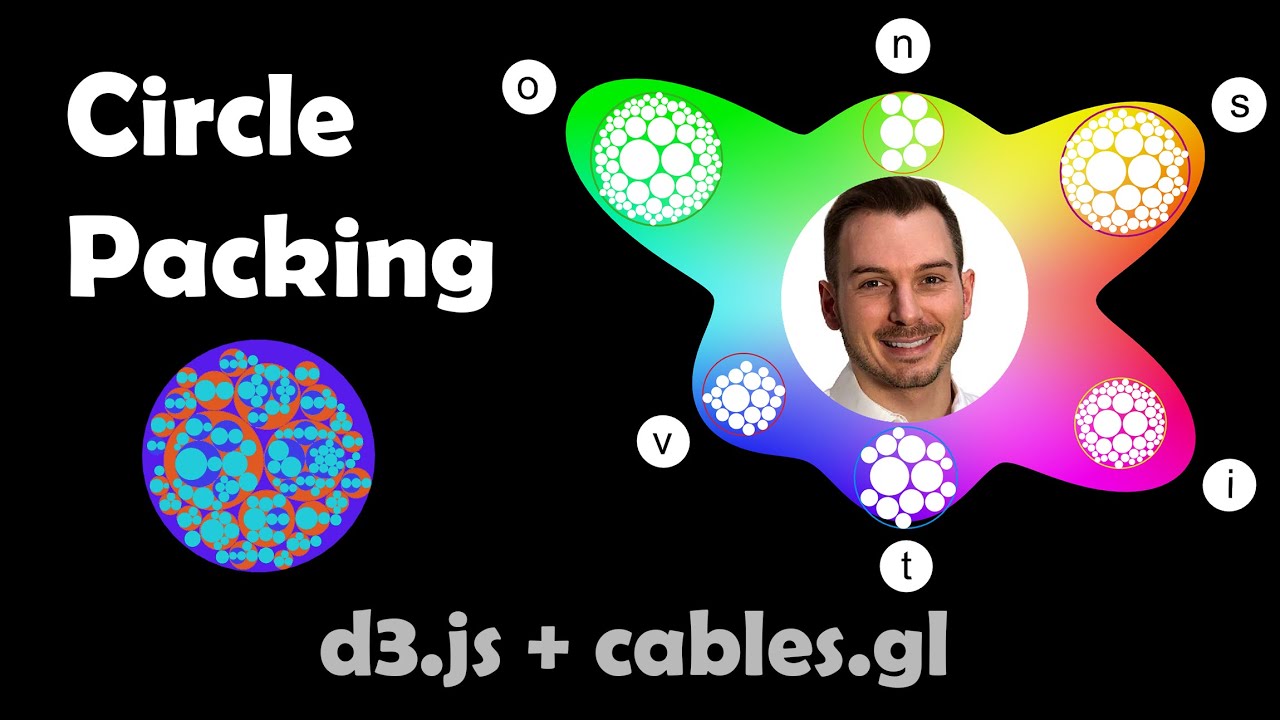
Data visualization: Circle packing with d3.js and Cables.gl
Автор: Kirell Benzi
Загружено: 2022-01-24
Просмотров: 2626
Описание:
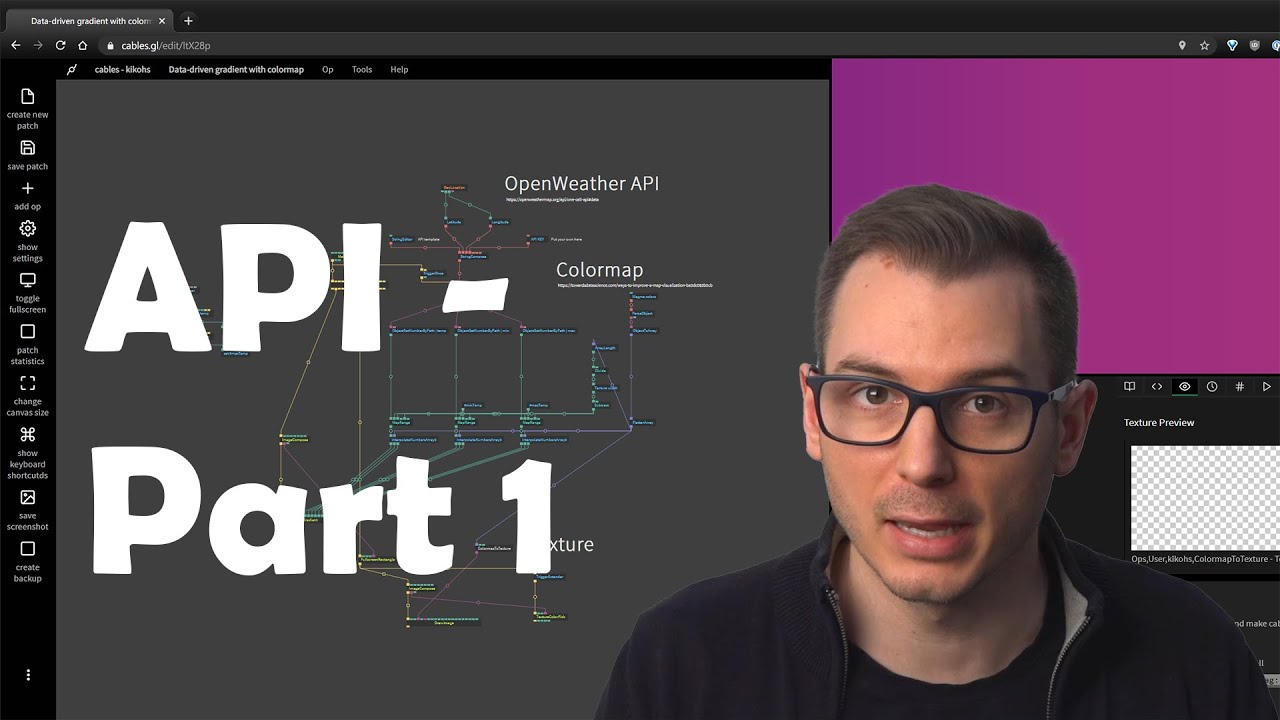
In this video I demonstrate how easy it is to use an advanced data visualization algorithm to represent hierachical content.
With the d3.js circle packing operators you can step up your data visualization game in WebGL and leverage all the Cables.gl ecosystem.
All the needed d3.js custom nodes are available in the patch here:
https://cables.gl/p/It61cW
Click on a custom node, in the parameter panel, click on the 3 dots and "clone op" to save it in your workspace. Be sure to include d3.js as an extra library in your OP settings.
If you use the OPs, please consider liking/subscribing for more content and link your patches in the comments :).
► Sign up to my data art newsletter (including tutorials): http://eepurl.com/dxfXbT
► Subscribe to “Kirell Benzi” on YouTube ☝️
Visit my website:
https://www.kirellbenzi.com
Follow me on social media:
/ kirellbenzi
/ kirellbenzi
/ kirellb
/ kirell.benzi
Do you have a question about data visualization or data art? Drop it in the comments below or tag me on Twitter with @kirellbenzi
#data #dataviz #datavisualization #dataart #d3.js #webdev #webgl
Повторяем попытку...
Доступные форматы для скачивания:
Скачать видео
-
Информация по загрузке: