How Do You Like XTOOL New Live Data Graphing Features?
Автор: XTOOL
Загружено: 2022-11-09
Просмотров: 1097
Описание:
XTOOL plan to release a new version App to update/add live data graphing features, including:
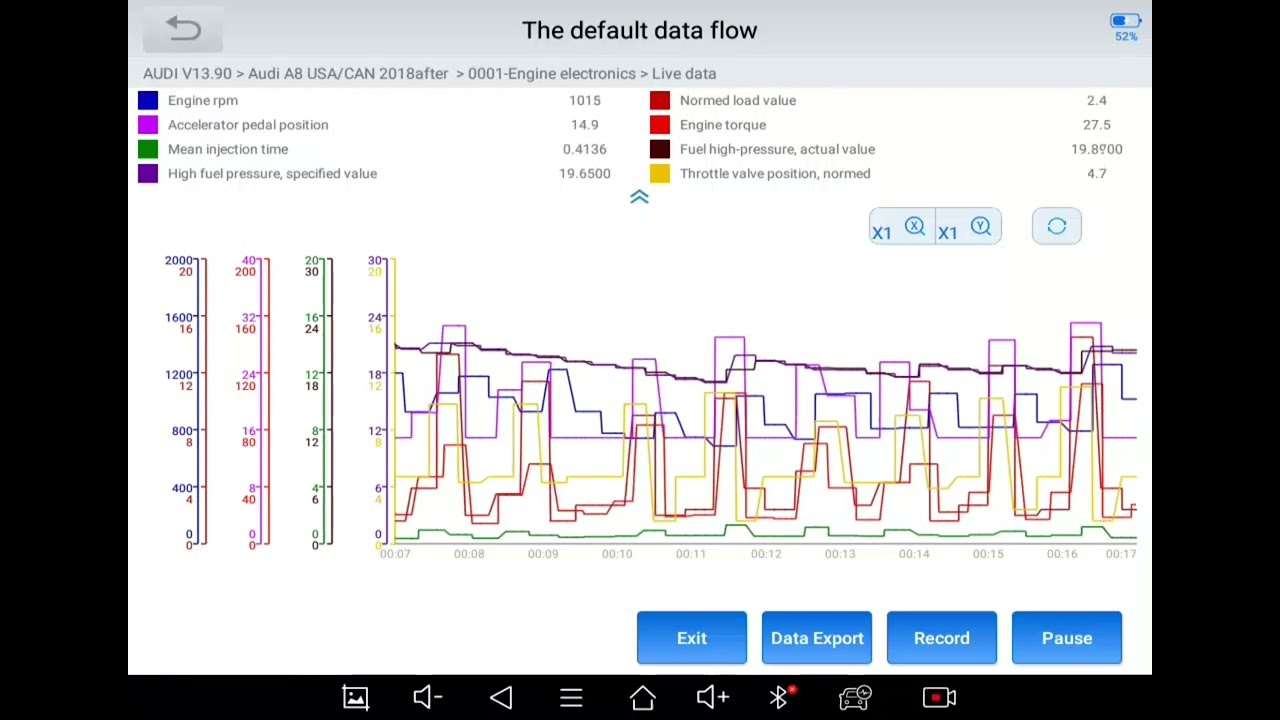
1: Select up to 8 sensors, view data stream and graph them.
2. Graph up to 8 sensors individually on the same screen.
3. Combine 8 graphs on the same screen.
4. Export data as CSV file and transfer to PC/laptop for later review & comparison, review the CSV data in graph & text through "Data View" on the scanner.
5. Customize the file name of the saved CSV.
6. Optimized sampling rate.
7. Adjusted graphing screen layout.
8. Setting maximum/minimum value triggers for specific sensor and display in red when it's triggered.
We'd love to hear your thoughts on these new features/improvements:
Facebook Group: / 699398177963318
Reddit Sub: /r/xtoolscantools/
Join XTOOL test program to make the tools a better one:
If you are an expert in diagnostic tools, master tech with many years of experience in car repairing(gas, diesel, hybrids, electric) and would love to test our tools and help us improve, welcome to join our test program.
Повторяем попытку...
Доступные форматы для скачивания:
Скачать видео
-
Информация по загрузке: