How to Plot Statistical Group Comparisons in R: ggstatsplot
Автор: StatistikinDD
Загружено: 2021-11-18
Просмотров: 2976
Описание:
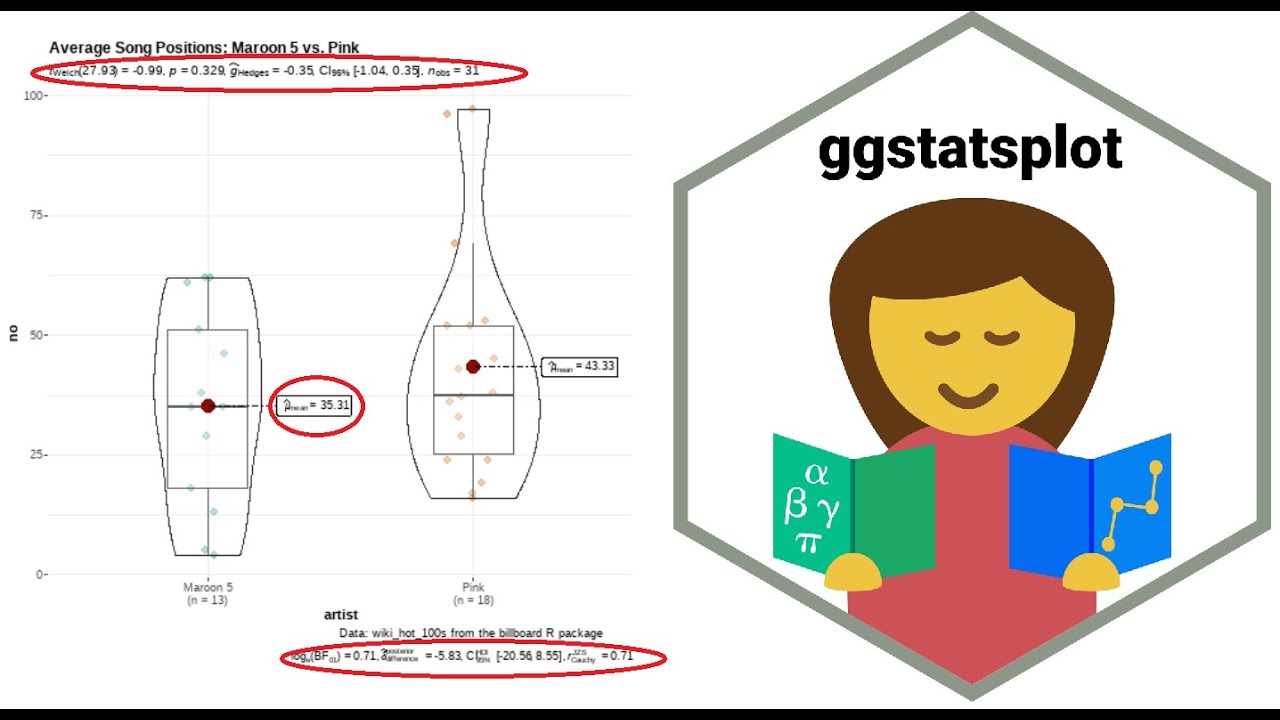
A lot of time can be spent on polishing plots for presentations and publications. Standard plots on group comparisons don't contain statistical information. Enter ggstatsplot by Indrajeet Patil: It offers convenience functions to create information-rich plots from very little effort.
Contact me, e. g. to discuss (online) R workshops / trainings / webinars:
LinkedIn: / wolfriepl
Twitter: / statistikindd
Xing: https://www.xing.com/profile/Wolf_Riepl
Facebook: / statistikdresden
https://statistik-dresden.de/kontakt
R Workshops: https://statistik-dresden.de/r-schulu...
Blog (German, translate option): https://statistik-dresden.de/statisti...
Playlist: Music chart history
• Music Chart History
Повторяем попытку...
Доступные форматы для скачивания:
Скачать видео
-
Информация по загрузке:


![Boxplots in R with ggplot and geom_boxplot() [R- Graph Gallery Tutorial]](https://image.4k-video.ru/id-video/Ww5kQuHtqKQ)


