Скачать
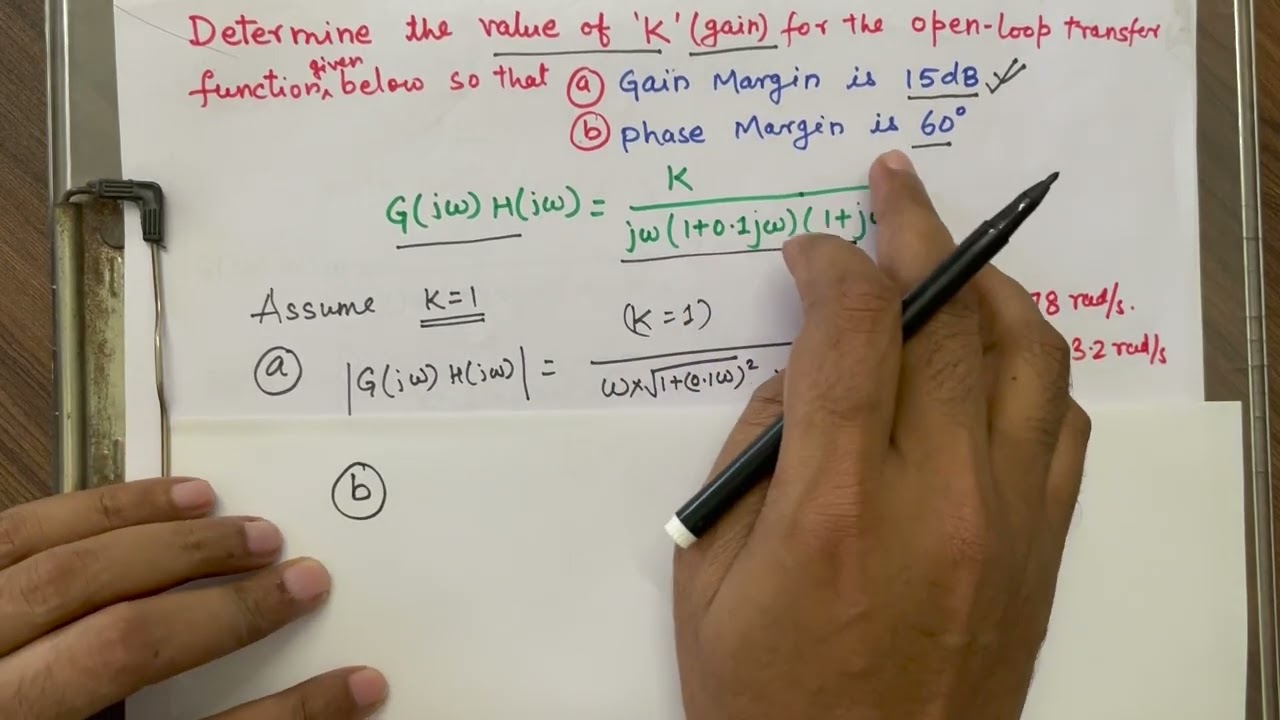
Q8.b Sketch the BODE plot for the transfer function and find value of K for Wgc=5 rad/sec.
Автор: EnggClasses
Загружено: 2024-11-25
Просмотров: 1947
Описание:
The video explains the concept of Bode plot in detail by considering an example.
#EnggClasses
#Control Systems
#Bode Plot
#Magnitude Plot
#Angle Plot
#BEC403
#VTU
#Solution to Question Paper
Не удается загрузить Youtube-плеер. Проверьте блокировку Youtube в вашей сети.
Повторяем попытку...
Повторяем попытку...

Доступные форматы для скачивания:
Скачать видео
-
Информация по загрузке: