ycliper

Популярное

Музыка Кино и Анимация Автомобили Животные Спорт Путешествия Игры Юмор

Интересные видео

2025 Сериалы Трейлеры Новости Как сделать Видеоуроки Diy своими руками

Топ запросов

смотреть а4 schoolboy runaway турецкий сериал смотреть мультфильмы эдисон
Скачать

How to create animated SVG elements for Power BI

Автор: BI Samurai / K Team Solutions

Загружено: 2023-01-04

Просмотров: 5241

Описание: 
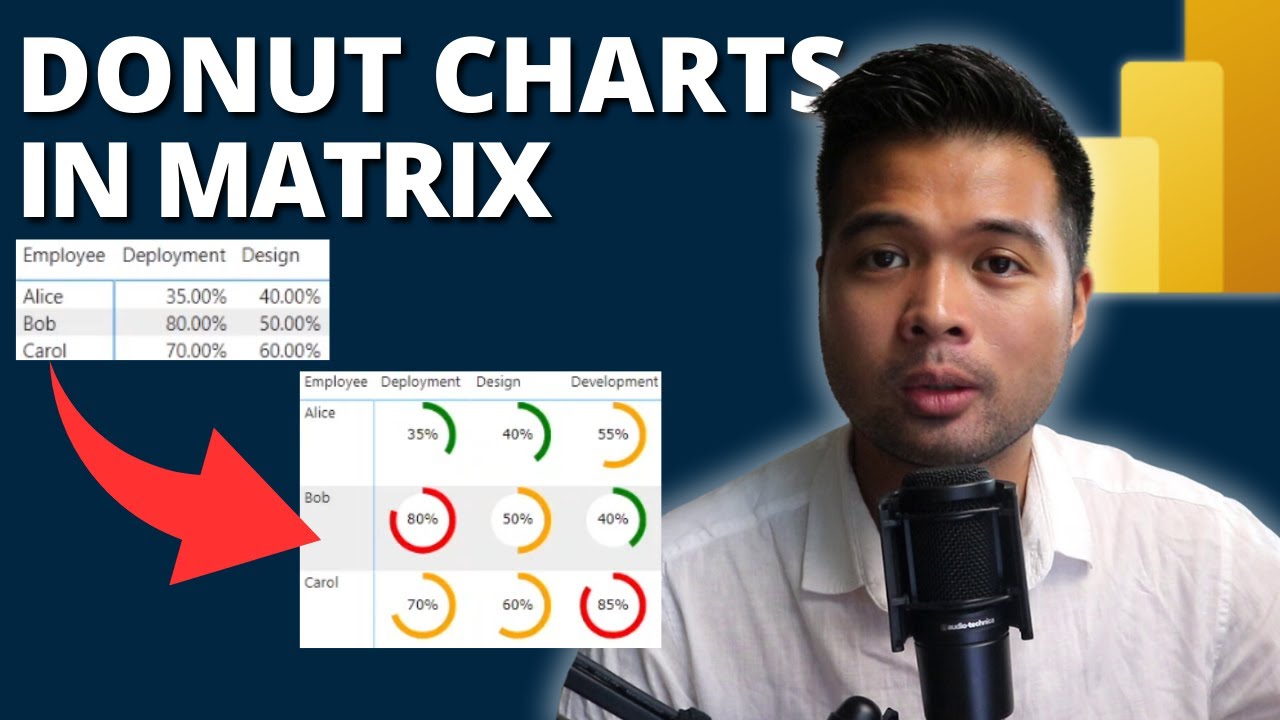
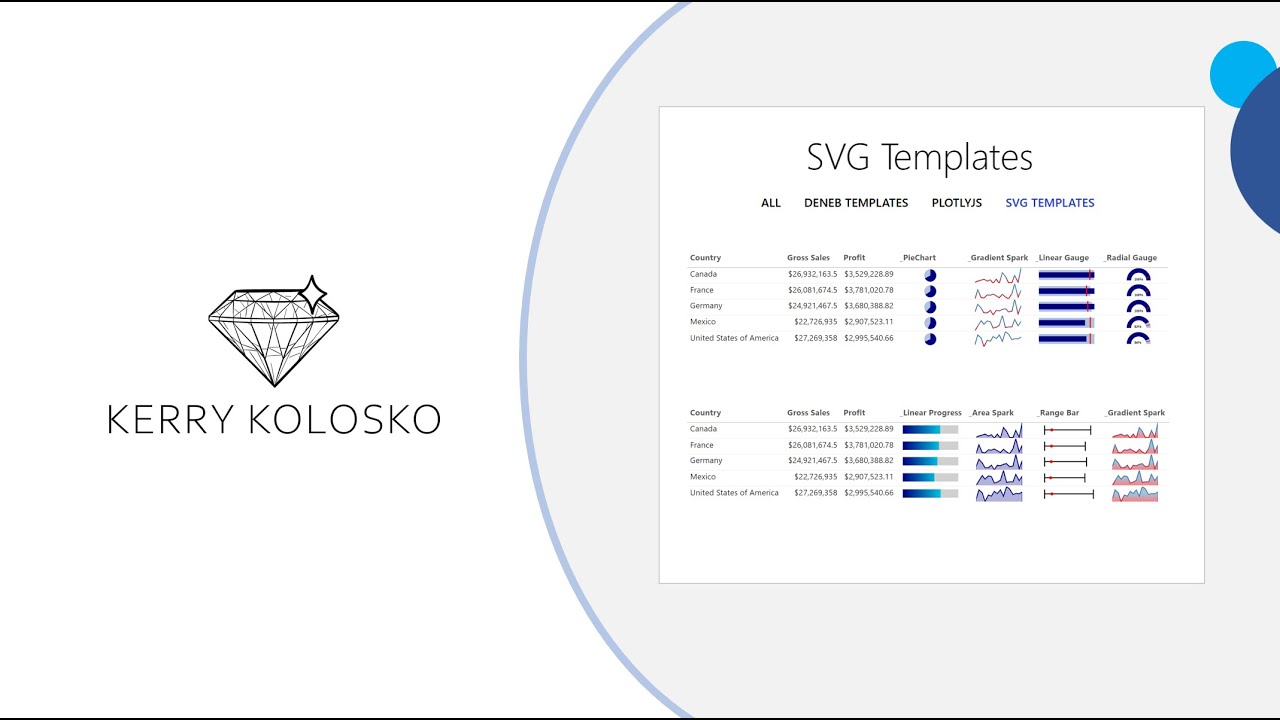
In this video, our design expert Ali presents how to design SVGs using Adobe Illustrator and make them dynamic using DAX in Power BI.
He's using the HTML VizCreator Flex custom visual to display the SVG in Power BI. This is to show that with our custom visuals, anything is possible.

Use the comments to let us know what Ali should create next.

*************
💬 Did you enjoy this video? Let us know in the comment section below!

✨ If you liked this video, consider subscribing to the BI Samurai YouTube channel and activate the bell icon to stay notified whenever there is a new video released 🔔! ⤵️
https://www.youtube.com/c/KTeamSoluti...

*************
Hello and Welcome to the official YouTube Channel of BI Samurai ☑️

BI Samurai is a BI Consulting company based in Switzerland. We implement Business Intelligence Solutions for our clients.
Our main focus is Power BI, but we also work with other tools from the Power Platform or Azure data family.

We can take over the implementation of Power BI from A to Z but can also improve existing reports, help with performance problems or any other topic related to Power BI.

➡️ We also have our very own Power BI visuals
1️⃣ The HTML VizCreator (Microsoft certified) is a must-have for anyone who wants to seriously improve the reports. It allows the user to create custom elements using HTML.
2️⃣ The HTML VizCreator Flex can be used to create all sorts of dynamic elements and is a great addition to any Power BI report. It is more powerful than the HTML VizCreator Cert, but not Microsoft certified
3️⃣ The Balance Sheet Visual is great to display a balance sheet in a way that even non-finance-experts easily understand it.

*************
✅ Where to find out more about us:

Website ▶️ https://bisamurai.com
Support ▶️ https://bisamurai.com/support
HTML VizCreator Cert ▶️ https://bisamurai.com/html-vizcreator...
HTML VizCeator Flex ▶️ https://bisamurai.com/html-vizcreator...

✅ Follow BI Samurai on social media:

LinkedIn ▶️   / bisamurai  

*************
#bisamurai #powerbi #powerplatform #azure #customvisuals #htmlvizcreator

Не удается загрузить Youtube-плеер. Проверьте блокировку Youtube в вашей сети.
Повторяем попытку...
How to create animated SVG elements for Power BI

Поделиться в:

Доступные форматы для скачивания:

Скачать видео

  • Информация по загрузке:

Скачать аудио

Похожие видео

SVG Blink Animation | Highlights/Alerts in Power BI

SVG Blink Animation | Highlights/Alerts in Power BI

Visualizing Status Tracking Data in Power BI

Visualizing Status Tracking Data in Power BI

Turn Any IMAGE into an INTERACTIVE VISUAL in Power BI

Turn Any IMAGE into an INTERACTIVE VISUAL in Power BI

Create High Quality Animated Backgrounds in Power BI

Create High Quality Animated Backgrounds in Power BI

Создание в Power BI навигационного меню, похожего на веб-сайт, с индивидуальным дизайном.

Создание в Power BI навигационного меню, похожего на веб-сайт, с индивидуальным дизайном.

Почему Ядерная война уже началась (А вы не заметили)

Почему Ядерная война уже началась (А вы не заметили)

Unbelievable Smart Worker & Hilarious Fails | Construction Compilation #19 #fail #construction

Unbelievable Smart Worker & Hilarious Fails | Construction Compilation #19 #fail #construction

2026: тренды моушн-дизайна

2026: тренды моушн-дизайна

Create a DONUT CHART MATRIX showing PERCENTAGES using SVG in POWER BI // Beginners Guide to Power BI

Create a DONUT CHART MATRIX showing PERCENTAGES using SVG in POWER BI // Beginners Guide to Power BI

How to use Power BI SVG Microchart Templates

How to use Power BI SVG Microchart Templates

Изучите Webflow: интенсивный курс для начинающих

Изучите Webflow: интенсивный курс для начинающих

LLM и GPT - как работают большие языковые модели? Визуальное введение в трансформеры

LLM и GPT - как работают большие языковые модели? Визуальное введение в трансформеры

Shibuya After Dark – Lofi Rain, Cyberpunk Skyline in Heavy Rain | 4K

Shibuya After Dark – Lofi Rain, Cyberpunk Skyline in Heavy Rain | 4K

Using SVG to Create Stunning Power BI Reports

Using SVG to Create Stunning Power BI Reports

Создание диаграмм SVG в Power BI

Создание диаграмм SVG в Power BI

Создание пользовательских визуальных элементов в Power BI с помощью DAX

Создание пользовательских визуальных элементов в Power BI с помощью DAX

The ART of Subtle ANIMATION in Power BI

The ART of Subtle ANIMATION in Power BI

Customizable Height & Width for SVG Images in Power BI!

Customizable Height & Width for SVG Images in Power BI!

NATIVE PROGRESS KPI CARD using SVGs AND MORE // Beginners Guide to Power BI in 2025

NATIVE PROGRESS KPI CARD using SVGs AND MORE // Beginners Guide to Power BI in 2025

Transform your POWER BI in 20 MIN with Themes and Backgrounds

Transform your POWER BI in 20 MIN with Themes and Backgrounds

© 2025 ycliper. Все права защищены.


  • Контакты
  • О нас
  • Политика конфиденциальности


Контакты для правообладателей: [email protected]