Time vs Concentration Graph | Instantaneous & Average Rate Explained
Автор: Chemistry Wallah
Загружено: 2026-02-18
Просмотров: 7
Описание:
Graphical Representation of Rate of Reaction | Chemical Kinetics | Class 12 Chemistry
*Welcome to Chemistry WALLAH!*
In today's comprehensive lecture, we master the *Graphical Representation of Rate of Reaction* – a fundamental topic for Class 12, JEE, NEET, and B.Sc. students. Understanding the *Time-Concentration Graph* is essential for unlocking the entire chapter of Chemical Kinetics.
Many students memorize formulas but fail to grasp the concepts. In this session, we focus on *conceptual clarity* using high-quality graphics and detailed diagrams. We ensure your basics are rock solid.
---
📚 What You Will Learn
1. Time-Concentration Graph Basics
Why Time on X-axis and Concentration on Y-axis? What does the curve signify? We build the foundation from absolute zero.
2. Rate ∝ Slope (The Core Principle)
We prove that *rate is directly proportional to the steepness (slope)* of the curve. A steeper slope means a faster reaction – this is the key to solving graphical problems.
3. Visualizing Steepness with Triangles
We draw *right-angle triangles* on the graph to visually demonstrate how slope changes. The height (Δy) and base (Δx) of these triangles reveal the reaction's behavior.
4. Why Rate Decreases Over Time
Using **Collision Theory**: as reactants are consumed, concentration decreases → fewer collisions → lower rate. We show this on the graph: the curve starts steep and gradually flattens.
5. Instantaneous Rate of Reaction
*Definition:* Rate at a specific moment
*Method:* Drawing a *tangent* to the curve
*Application:* Crucial for fast reactions and competitive exams
6. Average Rate of Reaction
*Definition:* Rate over a finite time interval
*Formula:* ΔC/Δt
*Analogy:* Average speed of a car
7. Instantaneous vs Average Rate (The Comparison)
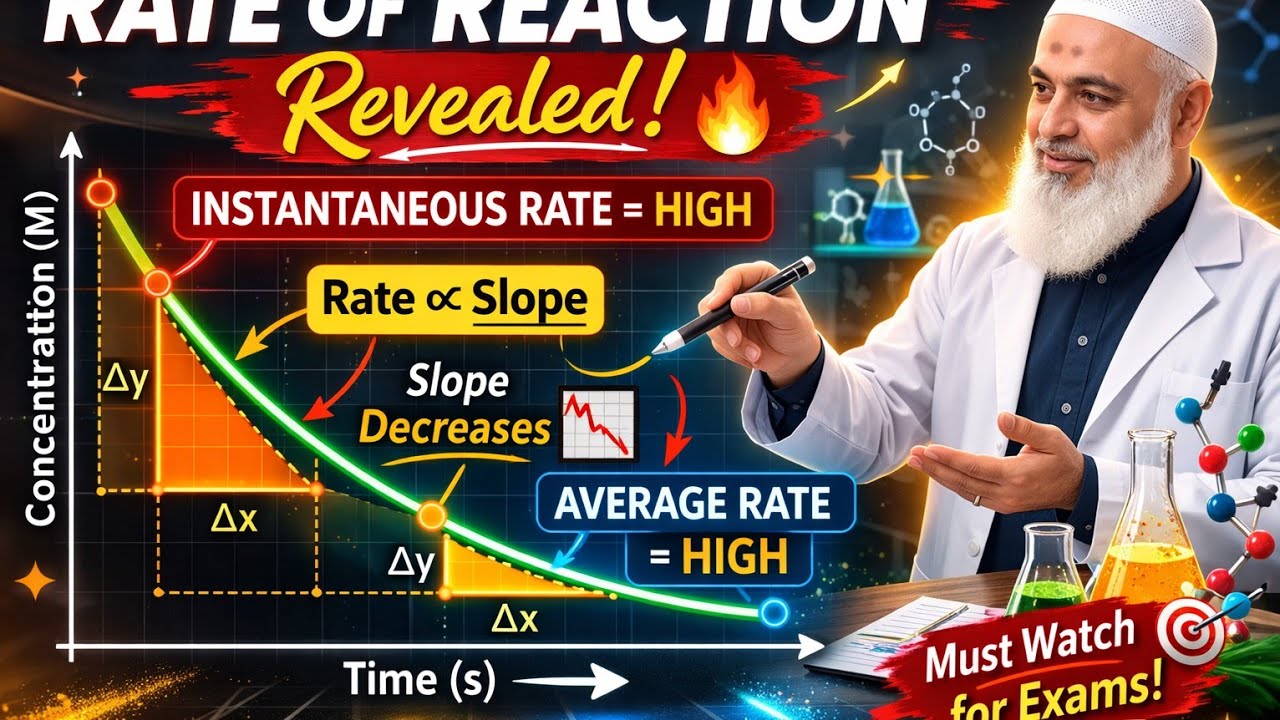
*Initial Stage:* Instantaneous Rate = HIGH, Average Rate = LOW
*Final Stage:* Instantaneous Rate = LOW, Average Rate = HIGH
We explain this visually using the steepness of the curve – no more confusion!
8. Numerical Problems (PYQs)
We solve *previous year exam questions* related to the graph, boosting your confidence for boards and competitive tests.
---
🎯 Why Watch This Lecture?
*Conceptual Depth:* We explain the "why" behind every concept
*Visual Learning:* Graphics make complex topics simple
*Exam Focused:* Guaranteed questions in CBSE, JEE, NEET
*Beginner Friendly:* Start from zero, reach expert level
---
👨🏫 About Chemistry WALLAH
*Chemistry WALLAH* is dedicated to making chemistry simple and accessible. Think of us as your personal Chemistry Professor, guiding you 24/7 through Class 11, Class 12, JEE, NEET, and B.Sc. Chemistry.
*Channel:* Chemistry WALLAH
*Handle:* @ChemistryWALLAH120
*Subscribe now* for more power-packed lectures!
---
⏱️ Timestamps
*00:00* - Introduction
*05:30* - Rate ∝ Slope Explained
*14:00* - Why Rate Decreases Over Time
*20:30* - Instantaneous Rate
*26:45* - Average Rate
*32:10* - Instantaneous vs Average Rate
*39:20* - Numerical Problems
*44:00* - Summary
---
🔥 Keywords for Maximum Search Visibility
Rate of Reaction, Chemical Kinetics, Graphical Representation, Time Concentration Graph, Instantaneous Rate, Average Rate, Slope of Graph, JEE Chemistry, NEET Chemistry, Class 12 Chemistry, CBSE Board Exam, Physical Chemistry, Rate Law, Collision Theory, Chemistry WALLAH
---
📢 Final Request
If this lecture helped you:
*LIKE* the video (👍)
*SHARE* with friends
*COMMENT* your doubts
*SUBSCRIBE* to Chemistry WALLAH
*Happy Learning!*
Повторяем попытку...
Доступные форматы для скачивания:
Скачать видео
-
Информация по загрузке: